Concern about Coronavirus and Political Messaging
A First Look
As states and the national government take action over the COVID-19 pandemic, there has been a large degree of variance in medical preparation across the nation. Contributing to these differences is something political scientists know well: partisan cue-taking.
Early on, the Trump administration downplayed the severity of COVID-19 outbreak, a message amplified by traditionally conservative media outlets such as Fox News. Given COVID-19’s relatively long incubation period, in which a person with the disease might not yet show symptoms, there is some concern over how initial delays might impact the spread of the virus. The cluster of COVID-19 outbreaks around Massachusetts, for example, appears to have been spread by those without symptoms, highlighting the difficulty in identifying and containing the virus’s spread. So, a lack of awareness of the way COVID-19 can spread while remaining invisible can greatly contribute to the spread of the virus, which is estimated to be exponentially more deadly than the seasonal flu.
Analysis
If COVID-19 is, at least for now, invisible to most Americans, what explains why some are concerned about it, while others are not? Because so much of the public’s knowledge of the pandemic and what to do about it has come from the statements of public officials, it is natural to assume that interest in the pandemic is related to factors such as partisanship.
Given the initial political polarization around the issue, one question that arises is whether areas in the U.S. with higher levels of support for President Trump were initially less interested in the novel coronavirus. To answer this question, I took advantage of the Google Trends tool, measuring searches for coronavirus during two periods of time (February 17-March 10, and March 10 -March 17), and breaking down the report by 206 Designated Market Areas (DMAs). From there, I computed the approximate proportion of voters in each DMA who supported Trump by aggregating county-level election returns from the 2016 president race (using data from the MIT Election Data and Science Lab dataverse). I matched counties to DMAs using the arealOverlap package in R.
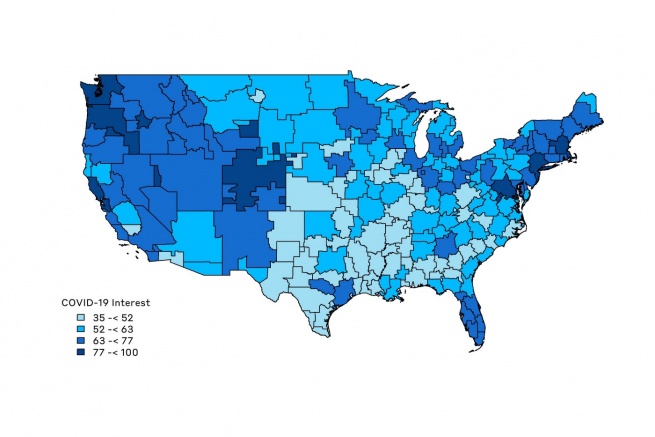
To analyze the initial level of interest in COVID-19 from mid-February to mid-March, I used Google Trends. This allowed me to compute a normalized score of COVID-19 interest for each DMA, with zero representing least interest and 100 for greatest interest. The map below shows the relative number of searches for “coronavirus” between February 17 and March 10. The most searches occurred in the Western and Northeastern US. These results make sense given that the outbreak began on the west coast, and given the Northeast’s position as a travel hub. On the other hand, Southern states displayed the least interest overall, with Florida the lone exception.
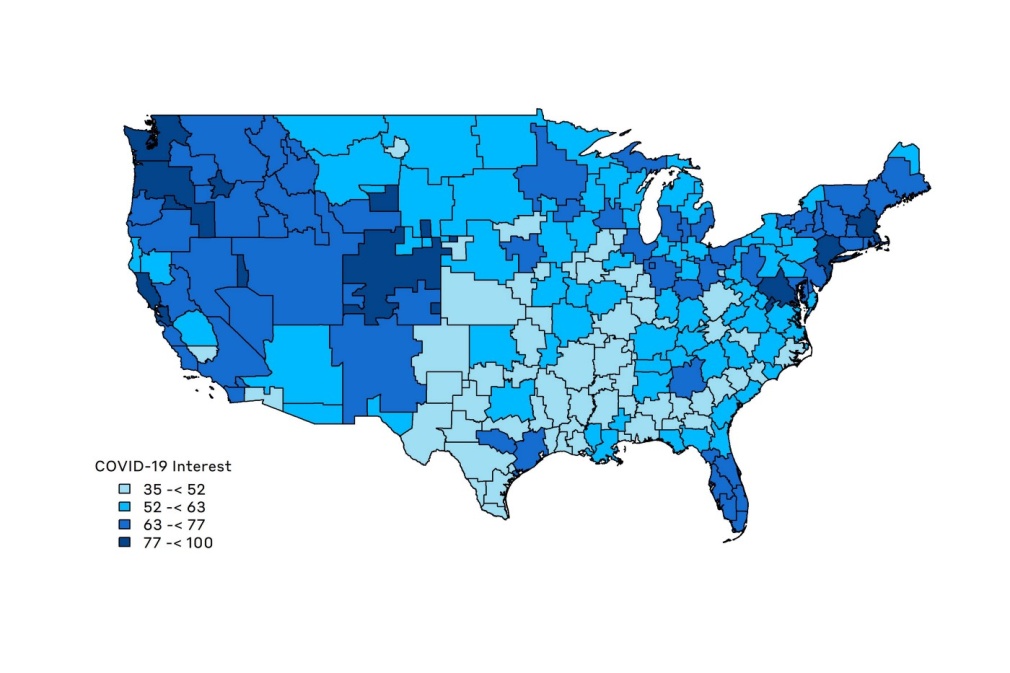
Google searches for coronavirus by designated market area, Feb. 17-March 10.
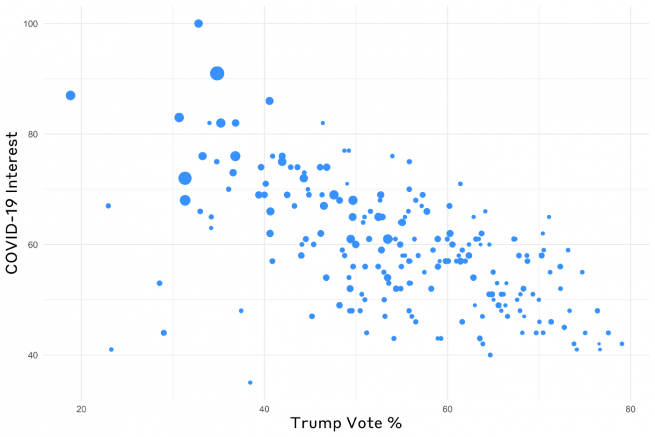
For an initial comparison, I created a basic scatterplot showing Trump support and interest in COVID-19 during the two different periods of time chosen. The first figure below presents the scatterplot for the period from February 17 to March 10, with points weighted by population. The correlation between interest in COVID-19 and Trump support is -0.58; this correlation would be stronger if not for a few outlying cases where Trump support is at its minimum and “coronavirus” searches were similarly low. Even with these outliers, the relationship is quite strong and in the direction that supports the hypothesis that Trump supporters, perhaps taking signals from the White House and conservative media, were less interested in the COVID-19 pandemic at first.
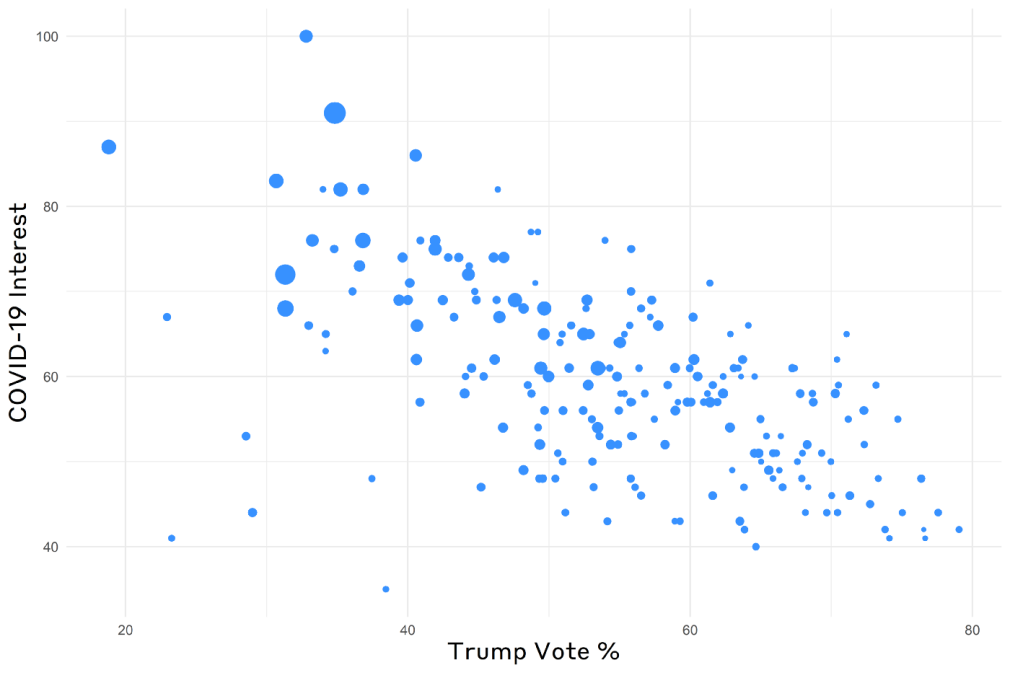
Correlation between COVID-19 interest and Trump support, Feb. 17-March 10.
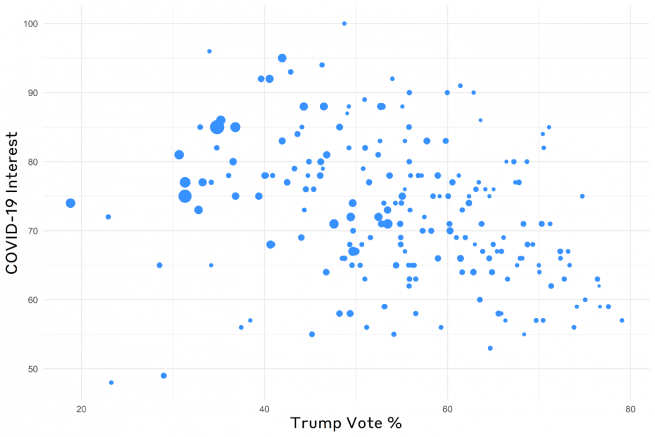
The picture changes when we analyze the same correlation the following week, between March 10-March 17.
Looking at the graph below, the correlation here drops to -0.28. We can also see that the DMAs with Trump support at 20-40% drive the correlation. Given that these areas were more interested in COVID-19 during the initial period when the U.S. outbreak was first drawing attention (and thus that those who would be searching for the information may have already learned it), it makes sense that searches in these areas related to COVID-19 would decrease. Again, these results offer some initial support to the idea that Trump supporters have shown less interest in the pandemic overall.
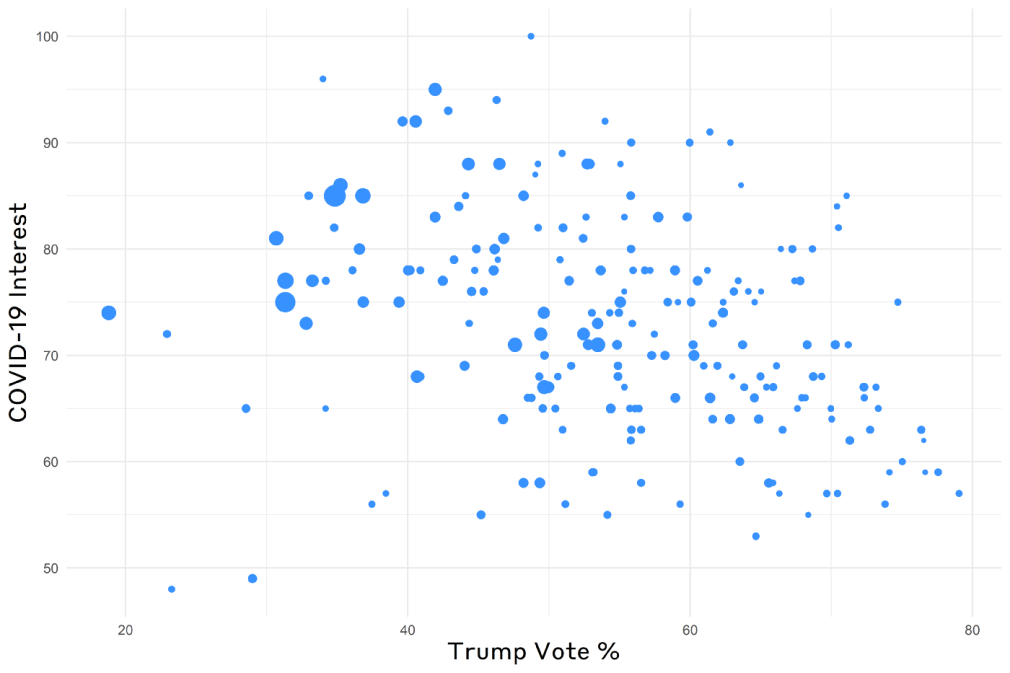
Correlation between COVID-19 interest and Trump support, March 10–March 17.
Robustness Checks
However, it might be the case that the results presented in the scatterplots are due to other variables that correlate with both Trump support and COVID-19 interest. In order to test the robustness of the correlation between Trump support and interest in COVID-19, I ran a Generalized Weighted Autoregressive Model (GWAM), which controls for the COVID-19 interest of neighboring DMAs. The correction for spatial bias will lessen bias related the influence of regional clusters.
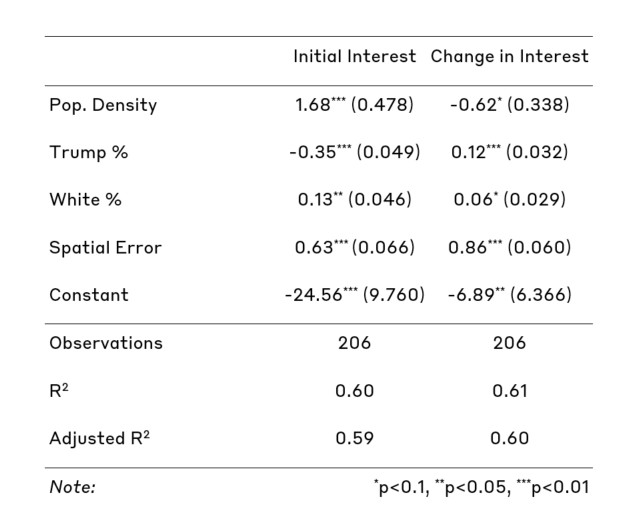
Additionally, opposition to Trump and interest in COVID-19 could be spuriously correlated because urban dwellers are more likely to be Democratic and are more likely to live around a large number of international travelers. Thus, I control for population density (measured as the logged population per square kilometer). I also control for the proportion of the population that is white. I then ran an additional model to measure the change in the interest of COVID-19 between the two time periods while taking these variables into account. The table below presents the initial interest model.
Overall, we see that it explains 60 percent of the variance, a fairly strong model fit. We additionally see that increased Trump support is negatively associated with interest in COVID-19 and reaches statistical significance. More urban DMAs, in addition to DMAs with a greater percentage of whites, are also significantly and positively associated with interest with the virus.
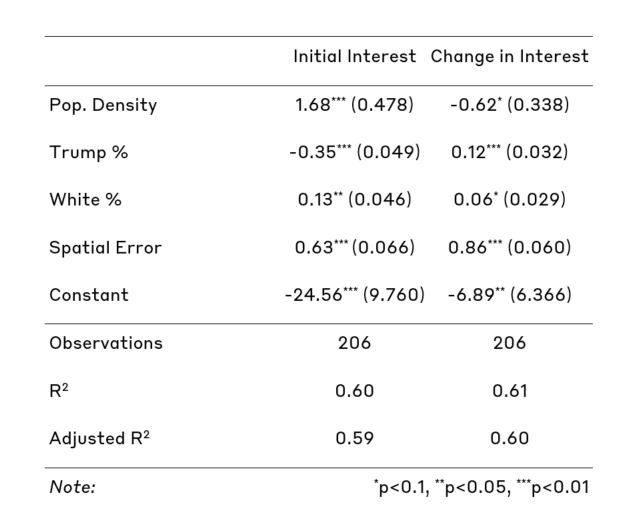
Spatial regression models of interest in COVID-19.
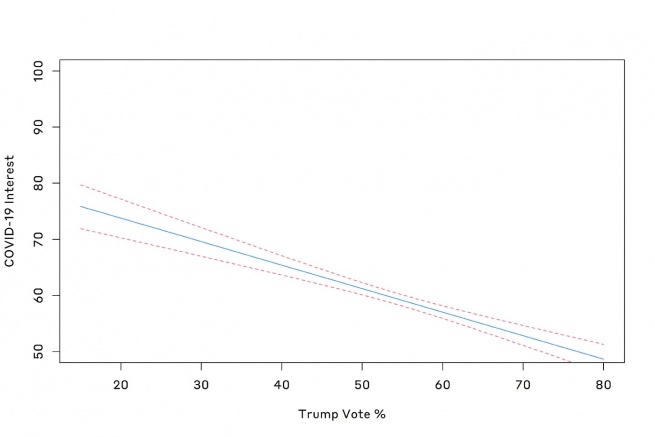
The next figure presents the predicted effect of Trump support, with Trump’s 2016 vote percent on the x-axis, and the level of COVID-19 interest on the y-axis. The solid line is the median estimated effect, and the dashed gray lines are the 95 percent confidence intervals. The plot demonstrates that given the model, moving from least to greatest levels of support for Trump decreases interest in COVID-19 by 20 points. Increasing Trump support by one standard deviation from the mean is correlated with a four point decrease in COVID-19 interest. And one standard deviation change in Trump support in turn is approximately one-third the size of the standard deviation of interest in COVID-19.
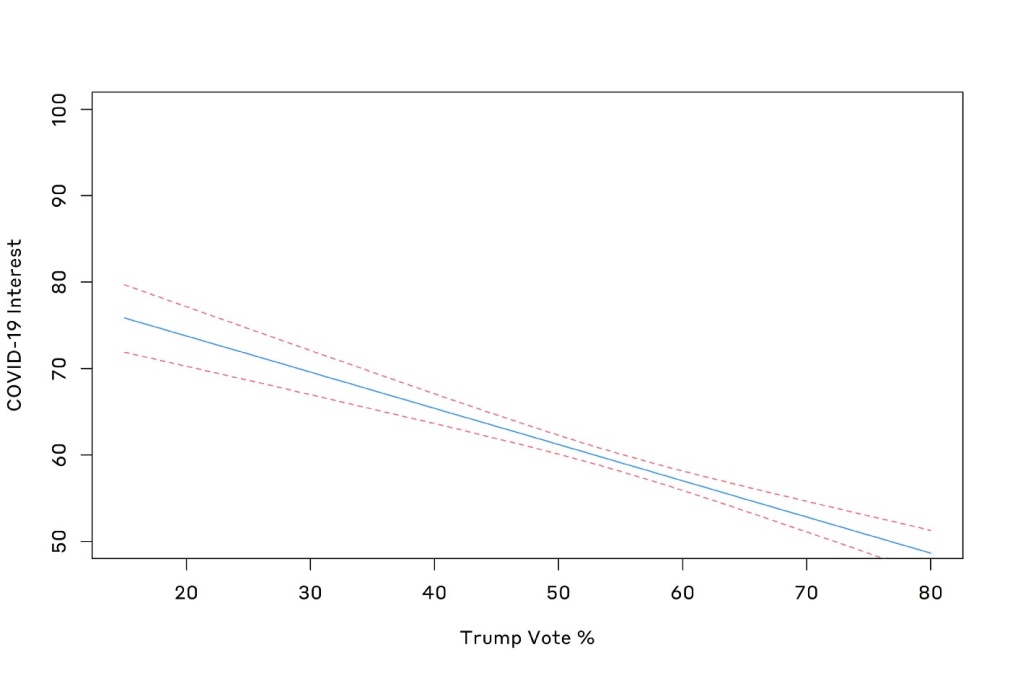
Predicted effect of Trump support on initial COVID-19 interest.
In looking at change in COVID-19 interest over the two time periods, we see that the directions of the coefficients change for logged population and Trump support, and reach statistical significance. However, the absolute size of the Trump support coefficient is significantly less than that of the same coefficient from the period of February 17-March 10.
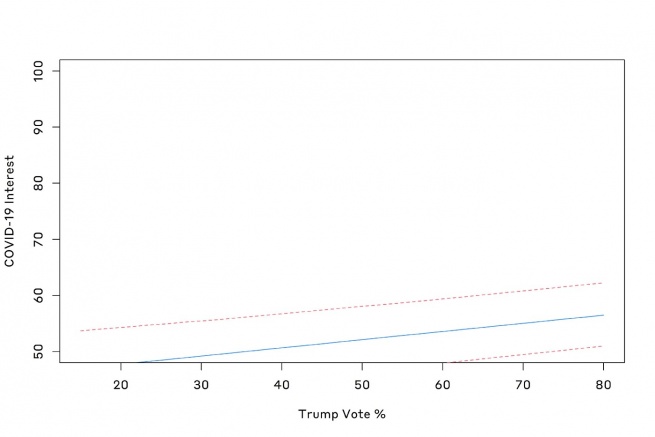
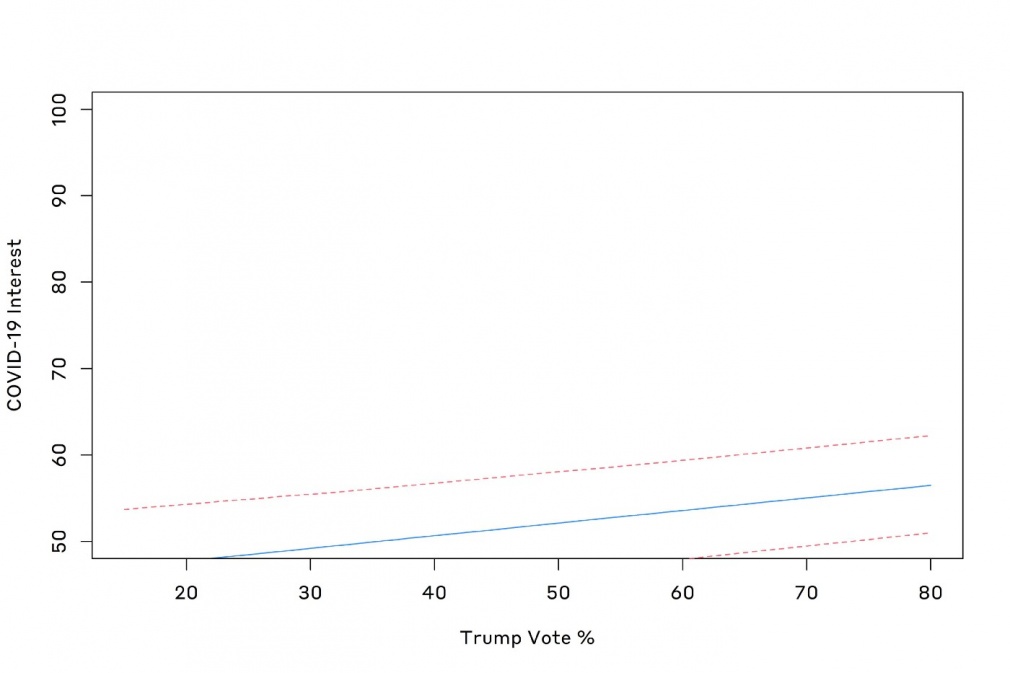
The graph below presents the predicted effect of Trump support from March 10-March 17 on interest in COVID-19. It is apparent that the effect does not make up for the initial disinterest in areas with high levels of support for Trump. Moving from minimum to maximum Trump support only increases interest in COVID-19 by five points. Increasing Trump support only raises interest by one percentage point, or one-tenth the size of the standard deviation for COVID-19 interest.
Discussion
These results offer some support to the claim that the initial messaging of the Trump administration and conservative media outlets dampened interest in the novel coronavirus among their supporters/viewers. Although more research needs to be conducted to ascertain the true causal effect, the evidence thus far presents some important implications. The results within the scatterplots are enough to warrant a further investigation, confirmed by the more in-depth spatial linear regression models. Additionally, polling reveals a wide discrepancy between Democrats and Republicans on the perceived threat from COVID-19. These independent confirmations are unlikely to be due to chance alone.
Given that it takes a relatively long time for coronavirus infections to become symptomatic, the disease has likely spread beyond initial control in areas that are not immediately prepped. Further, given the shortage of COVID-19 tests, it is almost certainly the case that there will be large numbers of individuals who have the virus but are unable to be tested. Containing the spread of the virus and limiting potential deaths depends entirely upon an educated public knowledgeable on how to prevent further infections. Public attempts to dismiss the severity of the pandemic actively go against these efforts. Even if these initial statements are walked back, it will take time to undo the effects, and in many ways the damage is already done, as the pandemic begins spreading exponentially across the U.S.
