COVID-19 and Polling Place Access in Wisconsin
States and localities across the nation faced extreme challenges in administering elections during the COVID-19 pandemic. Election administrators rose to the challenge for the general election in maintaining voter access, with the Cybersecurity and Infrastructure Security Agency (CISA) noting it to be the most “secure election in history.” However, the road to that point was not an easy one.
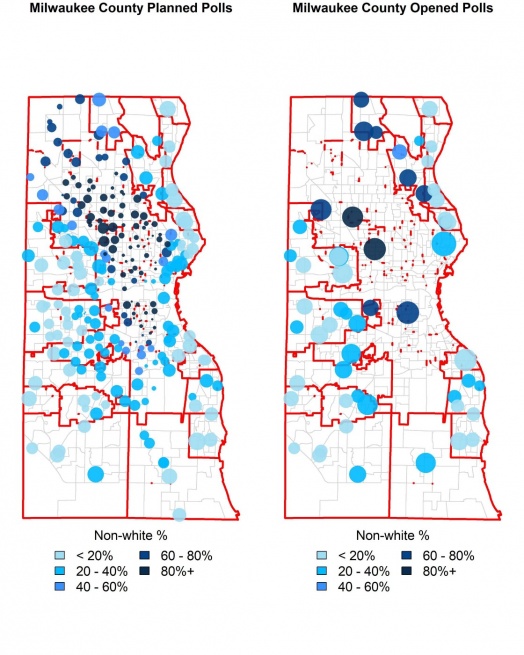
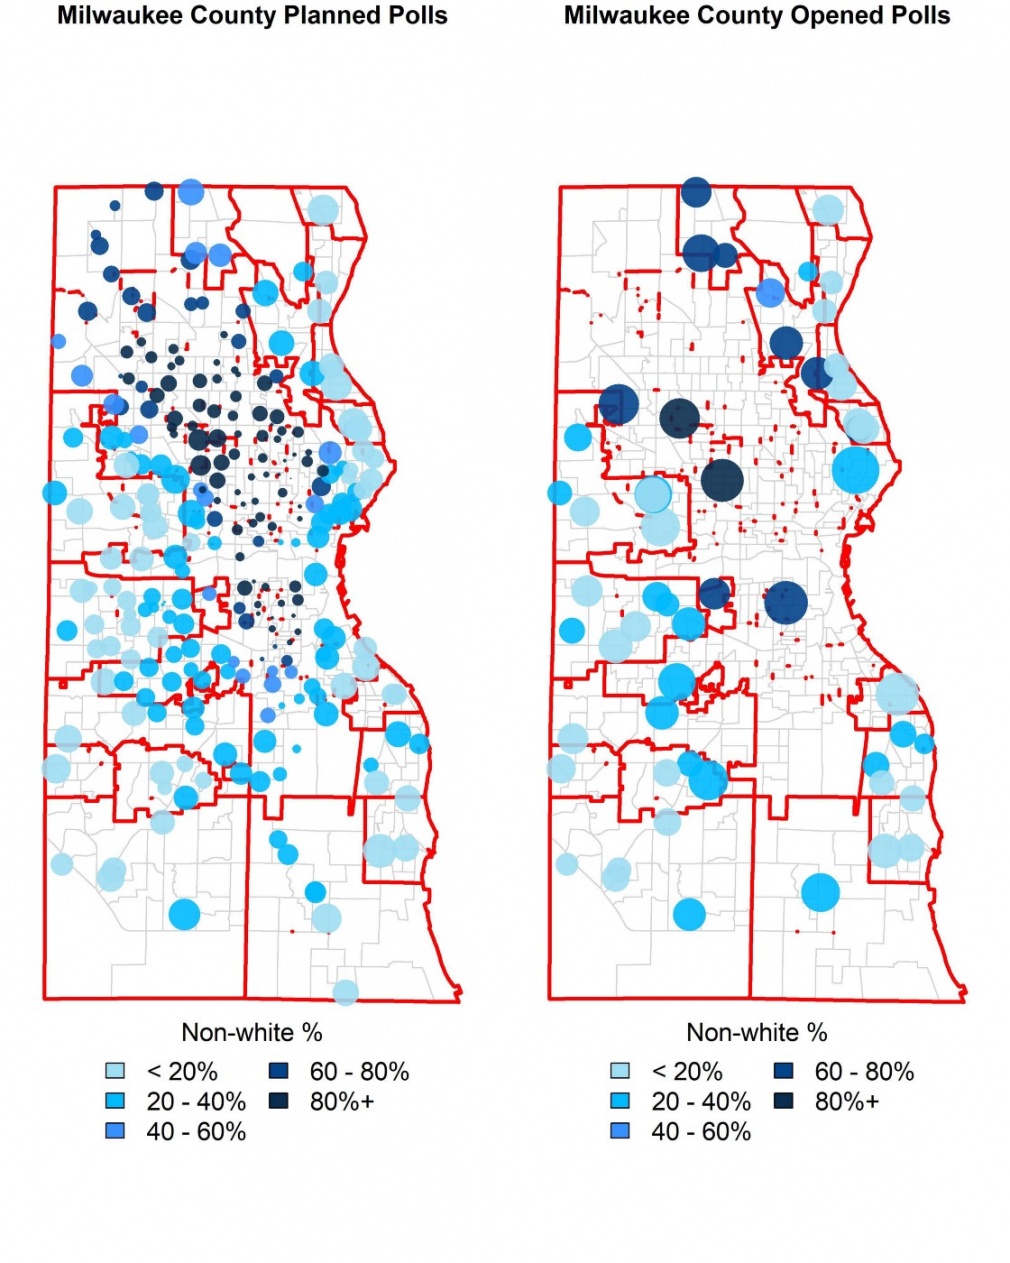
Wisconsin’s experience with the April 7 spring primary provided an object lesson to states and localities about the importance of preparation for voting during the pandemic. The City of Milwaukee lost all but five of its planned 182 polling places due to COVID-19, and concerns naturally arose as to the extent to which such closures affected turnout and exacerbated racial disparities in voter access.
We address the racial disparities in polling place access and the impact on voter turnout in the primary in an article forthcoming in the Election Law Journal. First, we ask, did polling place closures disparately impact non-white communities in Wisconsin, even when controlling for other confounders? Second, did these poll closures result in costs that substantively reduced voter turnout? Finally, were practices adopted that could have prevented the prevalence of poll closures and their impact on voter turnout? Our findings confirm that poll closures primarily affected racial minority communities and depressed voter turnout. Further, we find that jurisdictional actions leading up to the pandemic might have mitigated the impact of COVID-19 on the primary.
The Process
Media reporting at the time of the Wisconsin Presidential Primary uncovered wait times hours long in cities like Milwaukee, which arose from the reduced number of polling places and lower capacity to process voters in the remaining polling places. The City of Milwaukee also happens to be home to most of Wisconsin’s non-white population. Therefore, it’s possible that most of the narrative of racial disparities within the state primarily reflects what happened in a single city, and not the state as a whole.
Therefore, we use the Wisconsin Election Commission’s (WEC) election reports of polling place coordinates for each election. Through these reports, we know where Wisconsin jurisdictions planned to open polling places before the pandemic, versus where they actually opened. Over 1,850 jurisdictions closed polling places in the primary either due to a lack of equipment to safely hold an election or due to a failure of polling place workers to show up. We then use demographic information from the Wisconsin State Legislature’s GIS Open Portal to identify the types of populations that polling places served, concerning race, population density, and partisanship. We can then use an advanced statistical method called a spatial-autoregressive model to estimate how these demographics predict whether a polling place closed. With controls for whether neighboring polling places closed and county fixed effects, this technique allows us to ensure that some extreme case, such as Milwaukee, does not drive the results. Therefore, if a jurisdiction or two just happened to have higher non-white population and poll closures, we could identify null results and a lack of a significant relationship.
Our multivariate models demonstrates a positive and significant relationship between poll closures and the non-white percentage of a ward and the population density. However, given the multivariate nature of the model, we plot the results of the non-white population on the probability of poll closure. In the most white wards, the probability of poll closure is approximately 20 percent, all else equal. However, raising the nonwhite percentage to 50 percent increases the probability by 20 percentage points, surpassing 70 percent in the most nonwhite wards. These results arise despite the robust controls, suggesting it’s not a few jurisdictions or wards driving the results. Even at the more granular ward and polling place level, these closures disproportionately impact racial minorities within Wisconsin.
Impact on voter turnout
Poll closures can be expected to increase costs to voters in three ways: First, searching costs, where voters need to expend time and resources to figure out where their new polling location is. Second, travel costs, the change in travel time and distance to their new polling location. Third, queuing costs, the change in the time it takes to process a voter given the new burden at the polling location. As voters face these costs, they either lose valuable time to overcome these to vote or decide against voting given these costs. We know from the poll closure model that non-white and urban voters tended to face conditions expected to increase these costs. We next proceed to quantify these costs in two counties of interest: Milwaukee County, home to the city of Milwaukee, and Dane County, home to the state’s capital, Madison. These are the two most populous and racially diverse counties in Wisconsin, making them somewhat comparable.
Despite both being population centers susceptible to complications relating to COVID-19, election administrators made very different decisions about poll closures, which resulted in stark differences on April 7. Dane County and the city of Madison expended an additional $108,000, over 21 percent more than normal, to hire more poll workers and maintain polling places. The county and city of Milwaukee did not have the funds to do the same, and only had 300 to 400 poll workers, relative to the 1,400 that the City of Milwaukee alone usually employs. These choices led to relatively short wait times in Madison, and wait times several hours long in Milwaukee.
To identify the costs of voting within Milwaukee and Dane counties, we geocoded every address within the Wisconsin voter file as of the April 7 primary. We then matched and calculated the distance from each voter’s residential coordinates to their nearest polling place before and after the closures. We additionally found the number of people assigned to a given polling place before and after.
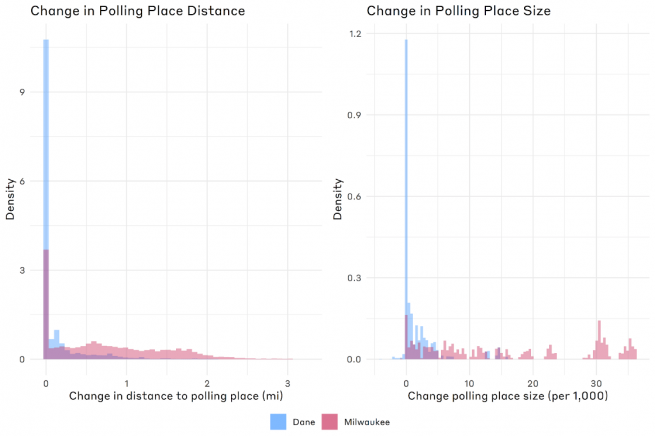
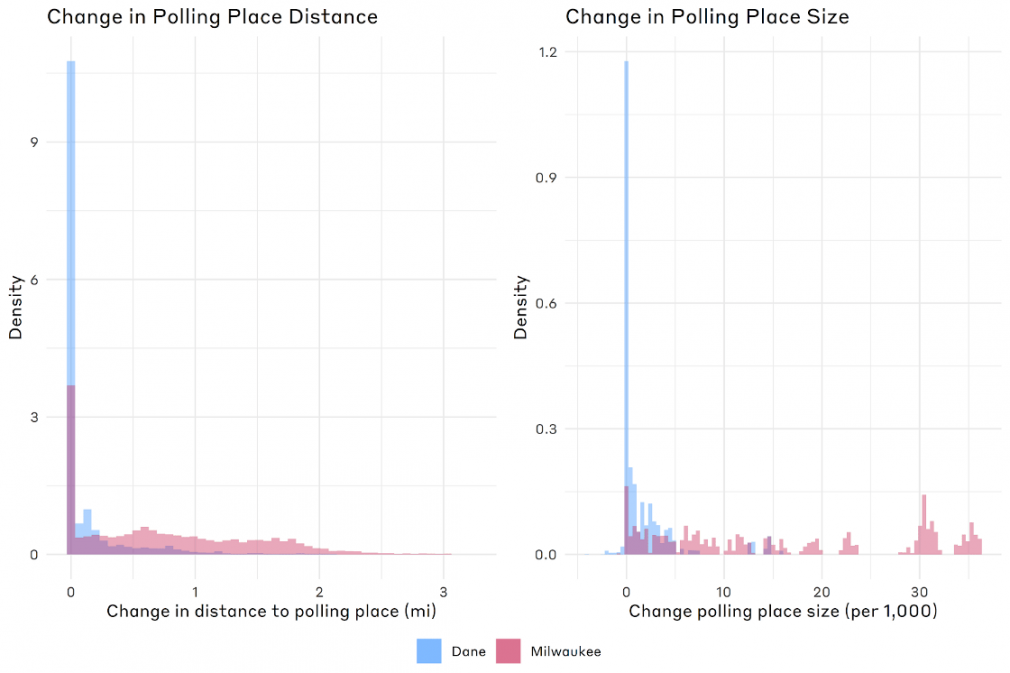
We plot the distributions of change in distance (left panel) and change in polling place size (right panel) above. We find that 69 percent of voters in Dane County saw no change in the distance to their polling location. This stands in stark contrast to Milwaukee County, where only 24 percent saw no change in distance to their polling place. Additionally, voters registered in Milwaukee saw a median change in distance of 0.62 miles, a third quartile at 1.27 miles, and a maximum of 3.2 miles. This compares to Dane County, which had a median change of zero miles, third quartile of 0.09 miles, and a maximum of 2.3 miles.
The right panel presents a similar pattern regarding the change in the voters assigned to polling places. In Dane County, 37 percent of all voters saw no change to the size of their polling place, compared to a mere five percent for Milwaukee. Unlike the distribution of polling place distance, the distribution for Milwaukee is not only skewed but not normal. The distribution is such that while the median for Dane County is only a change of 210 voters, for Milwaukee, it is 12,641. The third quartile for Dane is 2,341 voters as compared to 30,322 for Milwaukee. The maximum change in size is 16,038 for Dane versus 36,318 for Milwaukee. Overall, these data suggest that while there were voters in Dane County who saw substantive changes in the distance and size to their polling places, Dane managed to minimize these costs. Milwaukee, in turn, saw not only a difference in degree but a difference in kind as to the costs born by voters.
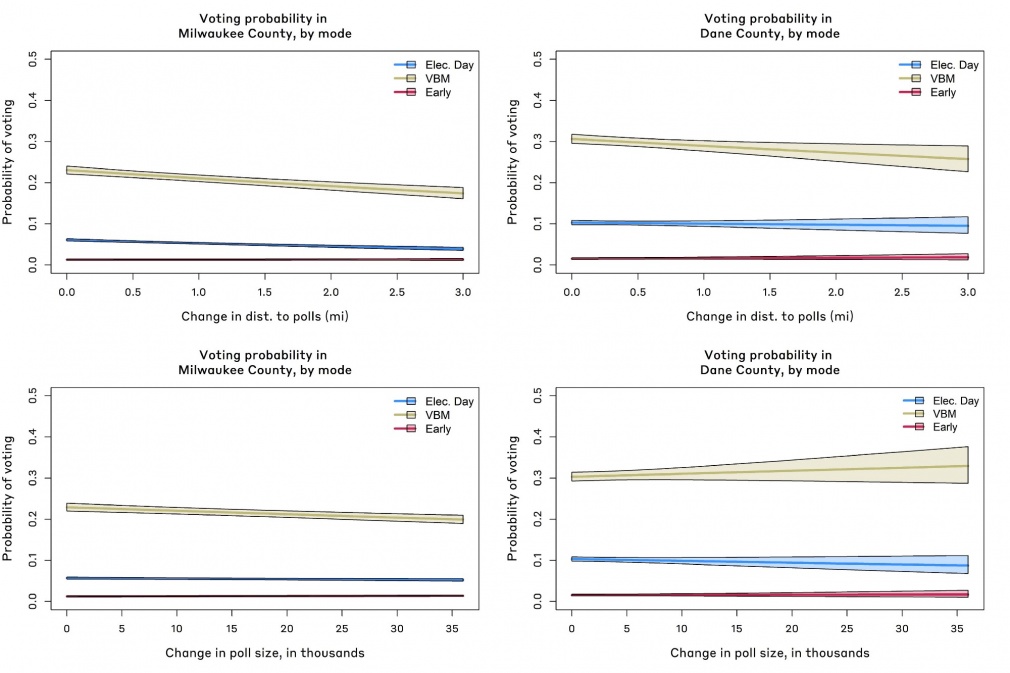
With these costs calculated, we predict the impact of these costs on the likelihood of voting by mode for Milwaukee and Dane counties separately. We additionally control for the voting history of the individuals, race, and ward. We find that within Milwaukee County, change in polling place distance and size significantly reduces the likelihood of voting. For Dane county, change in polling place size marginally decreases the probability to vote, and polling place size does not reach statistical significance.
We plot the predicted effect given the changes in polling place distance and size above, by mode. The top row presents the change in distance, and the bottom row the change in size. The left presents Milwaukee County and the right, Dane County. Given a one-mile change in distance to one’s polling place, the probability of voting drops by 2.4 and 1.0 percentage points for mail and Election Day voting, respectively, within Milwaukee, and a null effect for early voting. In Dane County, a one-mile change in distance is associated with an average reduction of 1.8 and 0.2 percentage points in voting for mail and Election Day, respectively, and a null effect for early voting.
Although there is no net effect for Dane, increases in polling place size reduces the voter turnout within Milwaukee. Given a 10,000 person increase of poll assignment, the probability of voting reduces by 1.0 and 0.2 percentage points for mail and Election Day voting, respectively, and a null effect for early voting. For the areas in Milwaukee that were the most affected by an increase in polling place size, the probability of voting drops by 3.5 and 0.5 percentage points for mail and Election Day voting. These effects likely impact mail voting given spillover effects from the general confusion incurred with larger precincts for voters still trying to decide the best means to vote. However, more fine grained research should be conducted on the matter.
To put these overall results in context, the estimated cost to turnout a voter is approximately $18 via canvassing. The overall effects of poll closures, especially within Milwaukee, are such that the estimated reduction in voting exceeds that of the campaign effects associated with a large get-out-the-vote canvassing effort.
Discussion
These results offer strong support that polling place closures overwhelmingly impacted non-white areas within Wisconsin. These polling place closures are not limited to a few odd clusters in cities like Milwaukee, but rather the trend carries over to the state at large. Additionally, these closures are directly associated with reductions in voter turnout, even controlling for a host of other factors, such as race. The effects of these closures due to an increase in the distance to the polls and an increase in the number of people voting in the remaining polling places are on par with voter turnout that a well-funded get-out-the-vote canvassing campaign would have generated. Therefore, the COVID-19 induced poll closures appear to have incurred serious costs on electoral participation.
However, there is a silver lining in our research. Dane County, and the city of Madison specifically, managed to keep far more polling places open by recruiting replacement poll workers and quick investments in protection measures against COVID-19. Additionally, while polls might have increased in size, preparations also brought more voting machines and poll workers to polling locations. Although larger polling places are associated with reduced turnout in Milwaukee county, Dane prevented such an association altogether.
Both Dane County and the city of Madison reduced the impact of COVID-19 through serious investment into their election infrastructure. Madison, in particular, spent record amounts of funds for the primary. While more research needs to be conducted on the specific decisions on the ground within each city — and it cannot be taken for granted that localities will be able to successfully adapt to future crises afflicting elections — these results are promising.
