Exploring Voting Equipment and Inequality in the 2016 U.S. General Election (Part 1)
Using county-level residual voting rate and demographic data to see how voting equipment can shape voting equality
The residual voting rate is used to calculate what percentage of ballots are uncounted in an election; the measure is typically used to assess the performance of election administration features such as ballot design, vote counting, and voting equipment quality.
Less confusing ballots, more effective vote counting procedures and mechanisms, and better voter equipment are often linked to lower residual voting rates. Conversely, antiquated voting equipment, such as the use of punch-card voting machines in the 2000 election in Florida, with the infamous “hanging chad” issue that prevented many legally cast ballots from being counted, can lead to higher residual voting rates. Having suboptimal election equipment can hamper the ballot casting process, and, as evidenced by the Supreme Court’s decisive decision in Bush v. Gore (2000) to end the recount in Florida and call the election, can have democracy-shaking implications.
In numerical terms, how much of an issue is the residual voting rate? Calculating residual voting rates for the 2016 presidential election, I employed county-level voter count and turnout data from the Election Assistance Commission (2016) and Leip’s Atlas of U.S. Elections (2019). The average residual voting rate across 2,765 of these election jurisdictions from each of the 50 states was 1.66%. While this might not seem large, one must remember that countless American elections are decided by margins far less than this percentage, and that 1.66% of all ballots cast — a total of 138,467,690 according to the EAC — amounts to 2,298,564 that were not counted. As measured from Federal Election Commission (2020) data, five states — Florida, Michigan, New Hampshire, Pennsylvania, and Wisconsin –had 1.34% or less of the two-party vote separating Trump and Clinton, and more counted ballots in these and other states may have resulted in a different election outcome. While some may think that the Bush v. Gore (2000) and punch card voting machine issues are part of the past, variation in voting equipment quality can still impact elections.
The Story’s Not Over: A Current Debate on Election Equipment
In an ideal democratic society, election machines should not be cumbersome to operate for either election workers or ballot casters, and they should perfectly translate voter intent to voter choice. A large reason for the technological evolution of voting machines is connected to these objectives Today,optical scanning and direct-recording electronic (DRE) machines have become the two dominant ballot casting mechanisms, with a small number of election jurisdictions making use of paper hand-counted ballots (Desilver 2016; Stewart 2014, 232). Optical scanning machines were first developed in the 1960s, permitting individuals to make “ink and pencil marks to be scanned by an electronic device” (Stewart 2014, 230). According to Stewart (2014, 232), 65% of voters in 2012 reporting casting a ballot using an optical scan machine. DREs came into existence during the 1970s, allowing individuals to engage in elections by recording their votes on a touch screen. As of 2012, Stewart (2014, 230) reports that approximately 30% of individuals submitted their ballot choices on DREs. But, as in earlier election machine periods of U.S. history, today there prevails debates over the suitability and possible need to update the dominant optical scanner and DRE election machines used in most election jurisdictions.
Herrnson et al. (2008) executed a multifaceted evaluation of these voting machines in a study involving expert reviews, controlled laboratory experiments, and field studies. While optical scan machines may partially avoid the voter intent discernment problem associated with punch card ballots, these researchers find that optical scan ballot users were more likely to report that ballot pages contained too much information, that it was difficult to correct vote problems, that there was a lack of verification that one’s ballot was correctly filled out and accepted, and that undervotes and overvotes were occasional problems because some optical scan systems lacked a confirmation mechanism that would tell individuals that they had incorrectly filled out the ballot. DREs, ideally, correct for these issues by providing voters with a convenience “similar to [using] ATMs at banks,” by not overloading voters with all the ballot information on a single screen, and by including more safeguards against undervoting and overvoting (Alvarez and Hall 2008; Herrnson et al. 2008, 50–52). However, Herrnson et al. (2008, 53) find that DREs have problems, too; they note the machines can be problematic for those with a lack of computer experience, because they may lack a voter verification mechanism, and because of security issues. In the wake of the 2016 election, security concerns about Russian infiltration into county and state electronic management systems that provide the software necessary to operate DREs has motivated a large number of jurisdictions to turn more to optically scan ballot (National Academies of Sciences, Engineering, and Medicine 2018; Schwartz 2018). Even with these problems linked to optical scanner and DRE machines, Herrnson et al. (2008, 48) found that individual users of these machines either agreed or strongly agreed that these machines inspired confidence, were easy to understand, were comfortable to use, and had overall satisfaction regarding their performance. A key question for this research is whether these election machines are more or less related to residual voting rates, with residual voting rates being used as a measure of the quality of such machines.
Evaluating the Impact
To examine election machine quality, this study uses county-level residual voting as the key outcome variable. The dataset includes 2,765 American county or election jurisdictions (Alaska is treated as a single election jurisdiction) across each of the 50 states, which is similar in geographic coverage to another recent residual voting study looking at the 2016 election (Stewart et al. 2020). Per county, this residual voting rate was constructed by dividing voter turnout by the number of votes cast for the November 2016 election. In the analyses reported in this post, a county’s residual voting rate is first correlated with a county’s election equipment, with this data provided by Verified Voting (2019). These pieces of equipment include paper ballots, optical scan machines, DREs, ballot marking devices, and voter verified paper audit trail technologies. A measure of a county’s per capita income, with data from the American Community Survey, is also included in these analyses because a county’s ability to acquire new or maintain current election equipment is contingent on the local tax base.
The correlation results indicate that optical scan machines — but not paper ballots or DREs — are significantly correlated with lower residual voting rates. Furthermore, optical scan machines, paper ballots, and vote verification technologies are also more likely to be located in higher income counties, while DREs are more likely to be in lower income areas. Higher levels of county income are linked to lower residual voting rates as well. According to Verified Voting, in light of recent concerns over the suitability of DREs, more jurisdictions (94%) have optical scan machines, compared to DREs (47% of jurisdictions) and paper ballots (7%). The correlational findings suggest that this change is linked to lower residual voting rates and appears to be driven by higher income counties that can more easily afford changes in voting equipment.
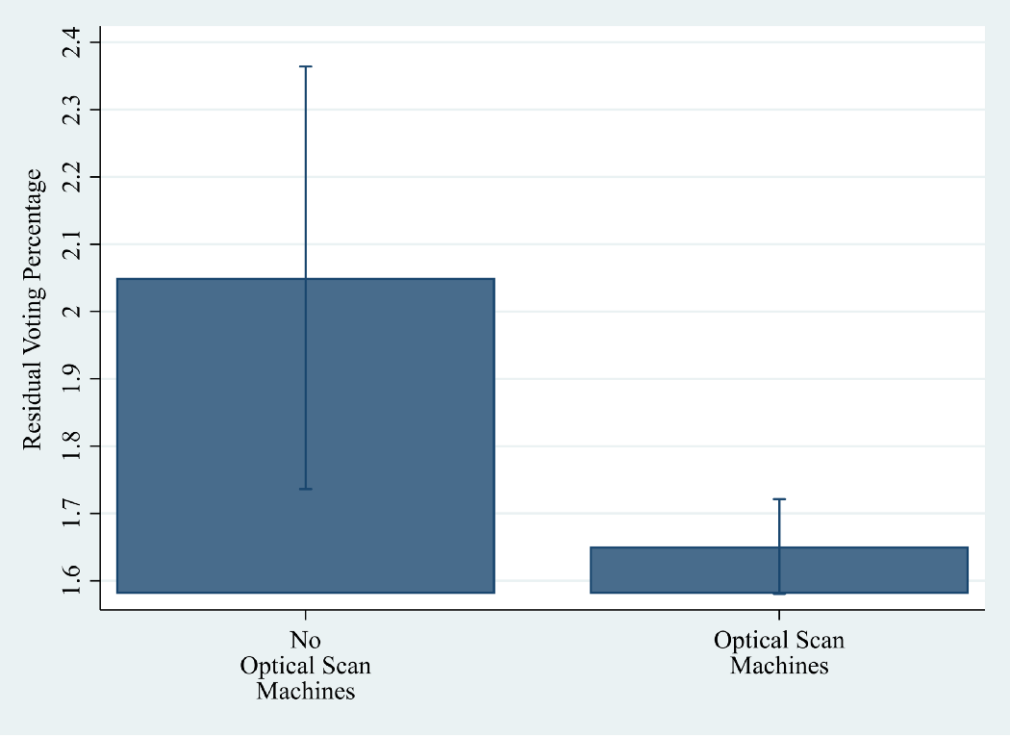
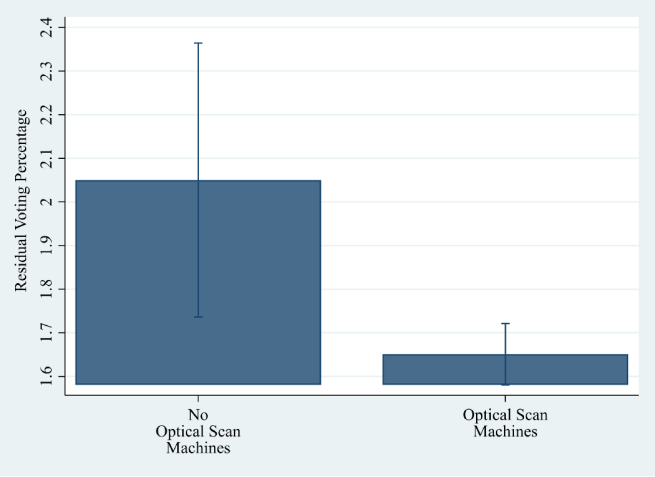
To more fully assess these results, regression analyses were conducted to control for other factors theorized to shape residual voting rates, including each of the voting technologies; a county’s per capita income, average level of education, and median age; the level of polling place resources in a county; mail voting; and whether a state also had a senate or gubernatorial election in 2016. State variables are also included to control for the possibility of other election administration factors shaping this outcome. The regression results confirm that optical scan machines are related to lower residual voting rates, relative to counties without this voting equipment. As shown in Figure 1, optical scan machines are related to a 0.5% decline in a county’s residual voting rate, from 2.05% to 1.65%. To put this percentage in perspective, 0.5% in 2016 equates to 692,338 ballots, a number of potential votes comparable to the population of Boston.

Figure 1: Residual Voting Percentages by County, varying Optical Scan Machines
Optical scan machines are an increasingly popular and efficacious piece of voting equipment. Relative to the other common pieces of voting equipment in use today (paper ballots, DREs, and ballot marking devices), optical scan machines are the only ones related to significantly lower residual voting rates. Indeed, individuals seem to place a high premium on being able to inspect and mark their ballot by hand, and then have their ballot counted electronically with a scanner either at the polling place or a central location (National Conference of State Legislatures 2018). Optical scan machines also offer the advantage of including a “paper audit trail by design,” which likely instills greater confidence both in prospective voters as well as election administrators (Gambhir and Karsten 2019 — Brookings Institution). As for the other voting equipment, hand-counted paper ballots are more feasibly processed in smaller jurisdictions, which perhaps explains their less pronounced effect on residual voting. Ballot marking devices are similarly not widespread, and are also more typically used by disabled voters, which may also explain their lack of effect in these analyses. DREs, lastly, may not have an effect because of functionality and security concerns.
Looking Ahead
Residual voting rates show that certain types of voting equipment are of higher quality. This higher-quality equipment tends to be more common in higher income counties that are theoretically better able to afford the latest such equipment. Optical scan machines are related to lower residual voting rates and are more common in higher income counties, likely reflecting the higher capacity of these areas to purchase and maintain quality voting equipment. However, these findings do not exhaust this inquiry. In the next post of this series, I will be examining my research regarding whether certain forms of voting equipment narrow or widen voting disparities by race and income.
Sources:
Alvarez, R. Michael, and Thad E. Hall. 2008. Electronic Elections: The Perils and Promises of Digital Democracy. Princeton University Press.
Bush v. Gore. 2000. 531 U.S. 98.
Desilver, Drew. 2016. “On Election Day, Most Voters Use Electronic or Optical-Scan Ballots.” Pew Research Center. https://www.pewresearch.org/fact-tank/2016/11/08/on-election-day-most-voters-use-electronic-or-optical-scan-ballots/ (accessed June 30, 2020).
Election Assistance Commission. 2016. “Surveys and Data.” https://www.eac.gov/research-and-data/datasets-codebooks-and-surveys (accessed June 30, 2020)
Federal Election Commission. 2020. “Election and Voting Information.” https://www.fec.gov/introduction-campaign-finance/election-and-voting-information/ (accessed June 22, 2020).
Gambhir, Raj Karan, and Jack Karsten. 2019. “Why Paper is Considered State-of-the-Art Voting Technology.” Brookings https://www.brookings.edu/blog/techtank/2019/08/14/why-paper-is-considered-state-of-the-art-voting-technology/ (accessed August 20, 2020).
Gumbel, Andrew. 2005. Steal This Vote: Dirty Elections and the Rotten History of Democracy in America. New York, NY: Nation Books.
Keyssar, Alexander. 2009. The Right to Vote: The Contested History of Democracy in the United States. Basic Books.
Herrnson, Paul S., Richard G. Niemi, Michael J. Hanmer, Benjamin B, Bederson, Frederick G. Conrad, and Michael W. Traugott. 2008. Voting Technology: The Not-So-Simple Act of Casting a Ballot. Brooking Institution Press.
Leip, Dave. 2019. Atlas of U.S. Elections. https://uselectionatlas.org/RESULTS/ (accessed June 1, 2020).
National Academies of Sciences, Engineering, and Medicine. 2018. Securing the Vote: Protecting American Democracy. Washington, DC: The National Academies Press. http://doi.org/10.17226/25120 (accessed June 30, 2020).
National Conference of State Legislatures. 2018. “Voting Equipment.” https://www.ncsl.org/research/elections-and-campaigns/voting-equipment.aspx (accessed June 22, 2020).
Schwartz, Jen. 2018. “The Vulnerabilities of Our Voting Machines. When Americans Go to the Polls, Will Hackers Unleash Chaos?” Scientific American https://www.scientificamerican.com/article/the-vulnerabilities-of-our-voting-machines/ (accessed June 30, 2020).
Stewart, Charles, III, R. Michael Alvarez, Stephen S. Pettigrew, and Cameron Wimpy. 2020. “Abstention, Protest, and Residual Votes in the 2016 Election.” Social Science Quarterly 101(2): 925–939.
Stewart, Charles, III. 2014. “The Performance of Election Machines and the Decline of Residual Votes in the United States.” In The Measure of American Elections, eds. Barry C. Burden and Charles Stewart III. Cambridge University Press
Verified Voting Foundation. 2019. https://www.verifiedvoting.org/verifier/ (accessed 6/29/20).


