How long did it take to count the vote in 2024?
Previewing our forthcoming report for the Stanford-MIT Elections Performance Central
As MEDSL prepares a post-election report that will update the Stanford-MIT Elections Performance Central with post-election data about the pace of vote counting in 2024, the extent of any blue- or red-shift in the vote, and trends from 2020 to 2024, we wanted to give you a sneak preview focusing on one timely question: how long did it take to count Americans’ votes in 2024?
By Samuel Baltz, with contributions by Sina Shaikh, based on a forthcoming report by Zachary Djanogly Garai, Sina Shaikh, Ning Soong, Samuel Baltz, and Charles Stewart III.
Counting votes in 2024
This year, votes were counted quickly enough that the winner was known by the morning after election night. However, that does not mean that all of the votes were counted on election night. Several states have not yet reached their official vote certification deadlines, and the last U.S. House contest was only called around December 3.
In the last presidential contest, held during the 2020 pandemic, the circumstances of the pandemic produced a slower vote count. For about three days after the election it was not clear which candidate had won. A MEDSL report found that “states were slower to report overall vote counts if they had large volumes of mail ballots, prohibited preprocessing mail ballots, and allowed mail ballots to arrive after Election Day.” This year, while there were enough votes counted to call the election quickly, some states still took several days or weeks longer than others to finish their vote counts.
Figure 1 shows how many votes cast for president were counted in each state from just before the first polls closed on election night until about 24 hours later. We collected this information from Edison Research through CNN every 5 minutes from 6 pm on November 5 until about 3 pm on November 6, at which point we switched to collecting it once every half hour.

Figure 1: The number of votes cast for president that were counted in each state in the span of about 24 hours after the first polls closed. The y-axis represents millions of votes. Data were collected from Edison Research through CNN.
Figure 2 maps the proportion of votes cast for president that had been counted by a certain time, over the same time period. For each county, we calculated the total number of votes that were cast for president as of the latest data reporting on December 4. For each timestamp that we collected in the 24 hours after the first polls closed, we calculated the proportion of all votes cast for president in that county that had been counted by that time.

Figure 2: A map of the proportion of votes cast for president that were counted in each county of the mainland U.S. over the span of about 24 hours after the first polls closed. Data were collected from Edison Research through CNN.
Figure 2 shows that most counties had counted and reported nearly all of their votes within 24 hours. States in the west and southwest — especially Washington, California, Nevada, Arizona, Utah, Colorado, and Alaska (not visualized) — stand out as having a larger proportion of votes left to count by the end of 24 hours. Mississippi, Maine, Maryland, Massachusetts and Michigan were also slower to report (there is no reason to suspect a causal connection between the letter “M” and vote counting speed). How long did these slower states take to report? Figure 3 extends the bar chart from Figure 1 to cover roughly a full month after the election.

Figure 3: The number of votes cast for president that were counted in each state in the span of nearly a month after Election Day. The y-axis represents millions of votes. Data were collected from Edison Research through CNN.
Figure 3 shows very little movement across the country for most of the period, with most large jumps due to California incrementally reporting about a third of its votes over the course of the month after Election Day. For the most part, other states that had substantial shares of votes unreported after 24 hours — including Washington, Arizona, and Maryland) — arrived close to their final vote counts by about 10 days after the election. Texas and Florida stand out as states that successfully counted an enormous number of votes (both well over ten million) within about a day, and required very few updates after that.
Figure 4 maps the data from Figure 3 as a proportion of all votes counted by a given timestamp, on a map, analogous to Figure 2 but covering the full month. It shows that for much of the last weeks or two, the major pockets of outstanding votes (by proportion, at least) have been largely in California, Mississippi, and Maine.

Figure 4: A map of the proportion of votes cast for president that were counted in each county of the mainland U.S. over the span of nearly a month after Election Day. Data were collected from Edison Research through CNN.
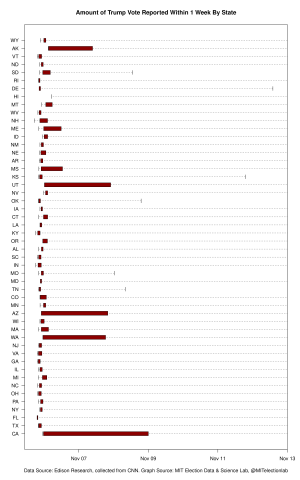
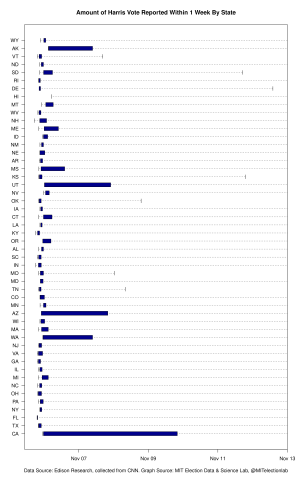
Of course, gifs of bar charts and maps do not facilitate specific quantitative description. Figure 5 shows the distributions of the vote for the two major presidential contenders that had been counted by each state in the week following Election Day.
(Click images to enlarge)
Figure 5: Box-and-whisker plots of the share of votes counted in each state in the week after the election, split into votes cast for Donald Trump and votes cast for Kamala Harris. The filled-in boxes represent the interquartile range, so that the lowest x-value of a red rectangle, for example, represents the moment when 25% of the votes for that candidate had been counted in that state, and the rightmost part represents the moment when 75% had been counted. The dashed horizontal lines show the full span of the data, beginning when the first vote was reported and ending when the last vote was reported (which is not visible on the plot if any votes were counted and reported after more than a week). Data were collected from Edison Research through CNN.
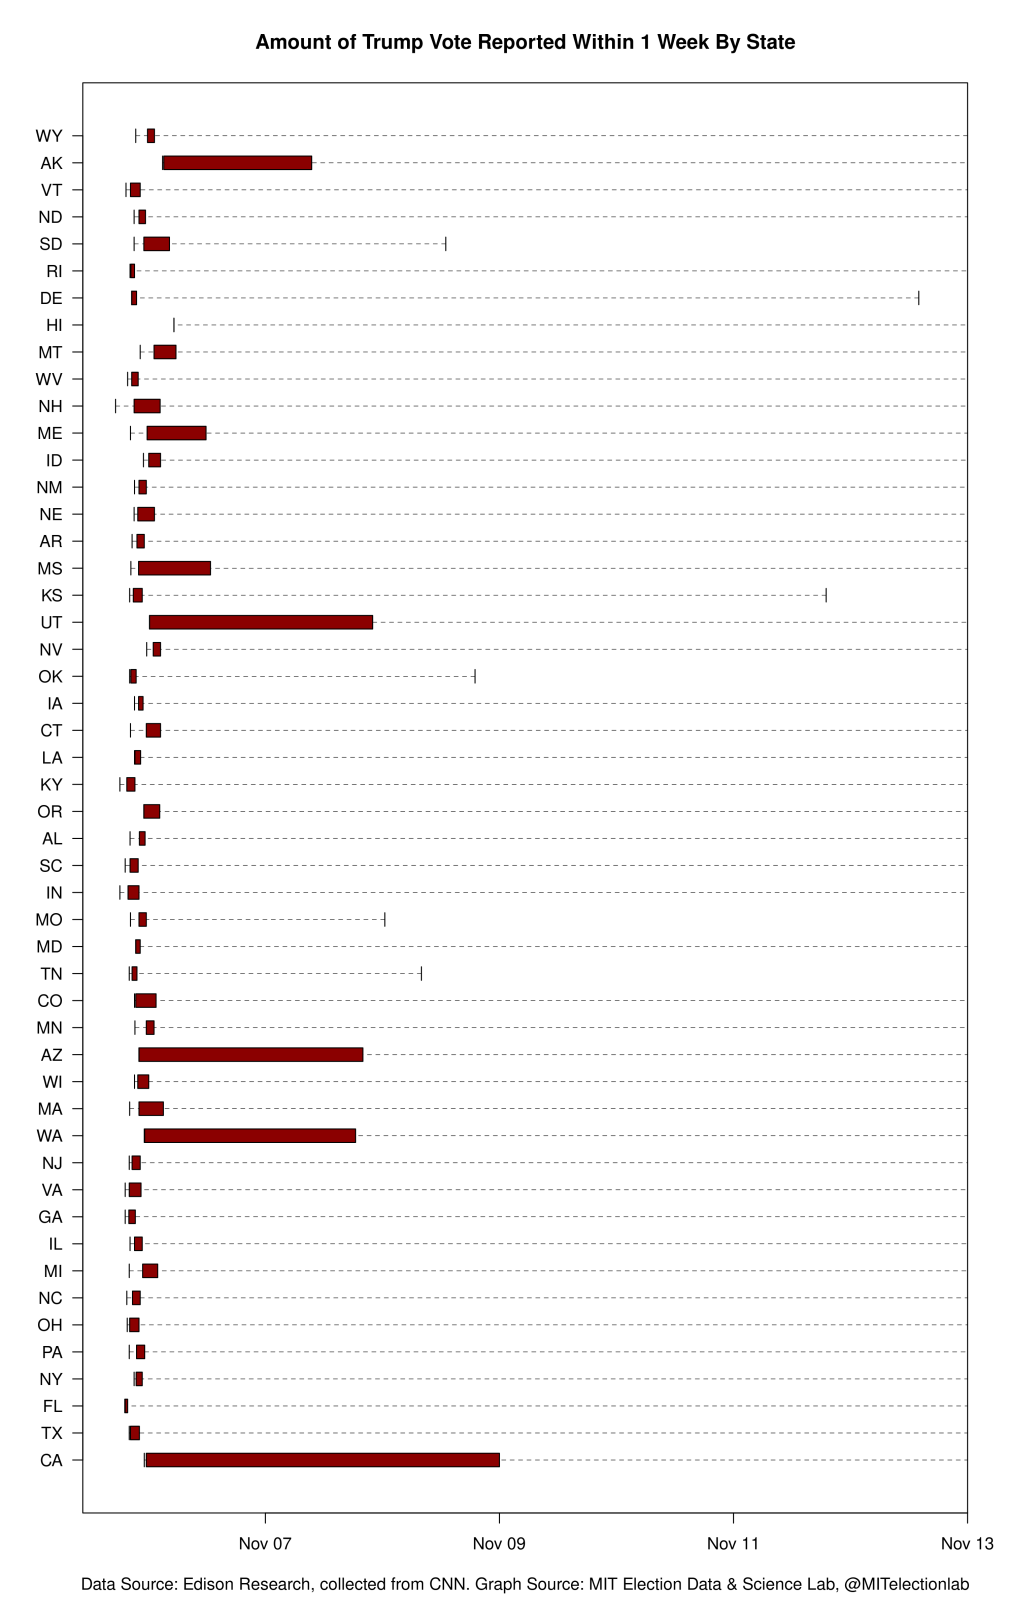
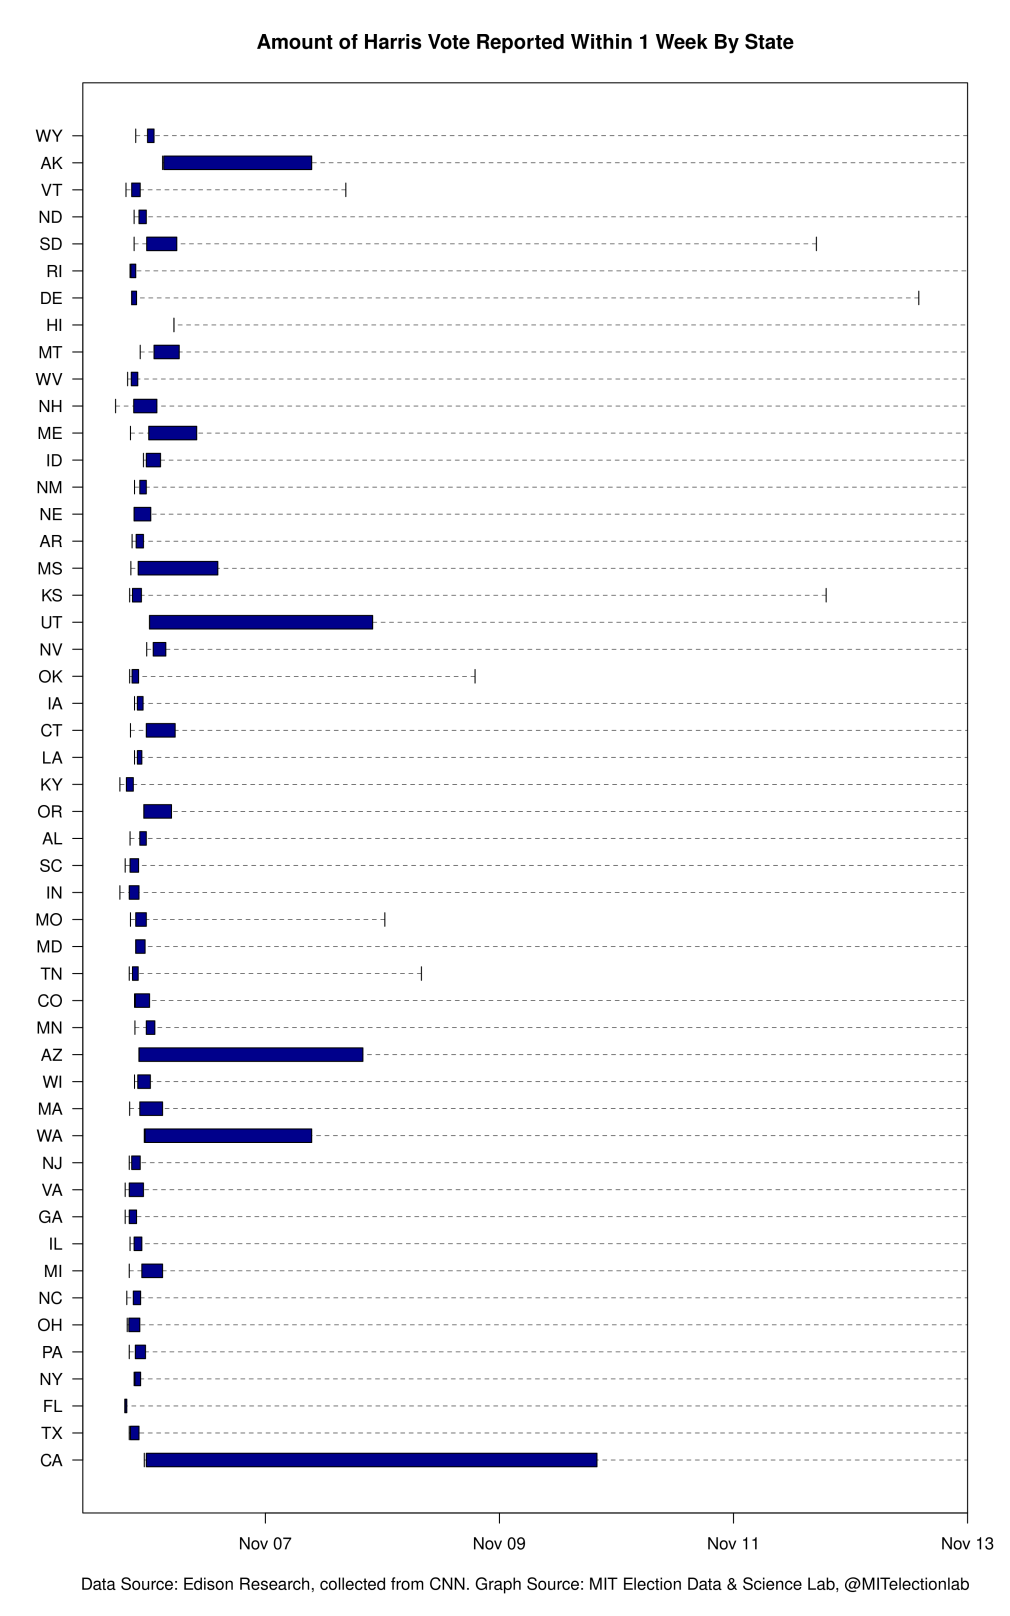
Figure 5 shows that every state had counted and reported more than 75% of votes cast for either presidential candidate within about 5 days. After California, the states that took the longest to reach that benchmark were Utah, Arizona, Alaska, Washington, Mississippi, and Maine. Every other state had reported 75% of the vote for either candidate within about 1 day, and often much faster. Figure 6 shows the pace of reporting in 2024, both at the state level and nationwide, over a period of hours, days, and weeks (compressed onto one logarithmic scale) for about 1 month after the election.
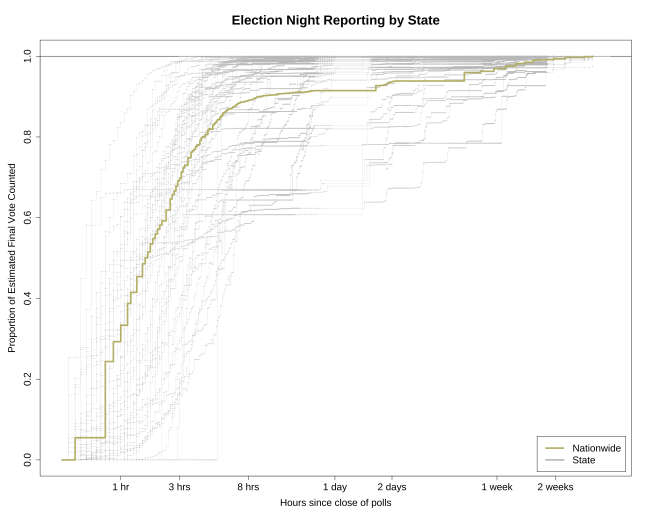
Figure 6: The proportion of votes cast for either of the two major presidential election contenders counted in each state (light grey) and nationwide (dark gold) in the hours, days, and weeks after the election, compressed onto a single logarithmic x-axis. A faint period reflects a power outage in the MEDSL offices; we aim to patch this with other data sources and update the figure. Data were collected from Edison Research through CNN.
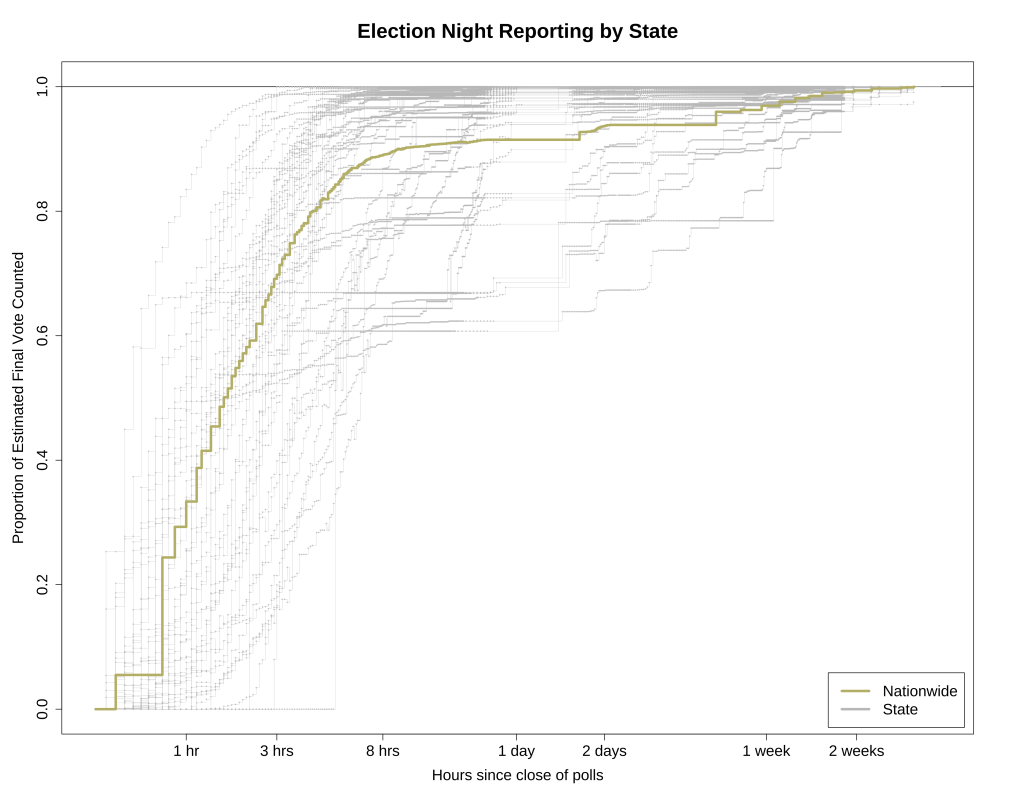
Figure 6: The proportion of votes cast for either of the two major presidential election contenders counted in each state (light grey) and nationwide (dark gold) in the hours, days, and weeks after the election, compressed onto a single logarithmic x-axis. A faint period reflects a power outage in the MEDSL offices; we aim to patch this with other data sources and update the figure. Data were collected from Edison Research through CNN.
Comparing 2024 to 2020
Figure 6 shows that even the slowest states had counted a majority of their votes within about 8 hours (and the fastest states had counted all or nearly all their votes in that time), and every state except one (California) had counted more than 75% of the vote after 2 days. Nationally, it took only about 2 hours to count a majority of the vote, and only about 3 hours to count 75% of it.
Clearly, this is a much different situation than in 2020. Figure 7 compares the vote counting speed in those two elections. While a majority of votes nationwide had been counted similarly quickly on election night in the two years, throughout the ensuing month, a larger proportion of votes had been counted in 2024 than at the corresponding moment in 2020 (with some artifacts induced by the different temporal granularity at which the data were observed in the two years).
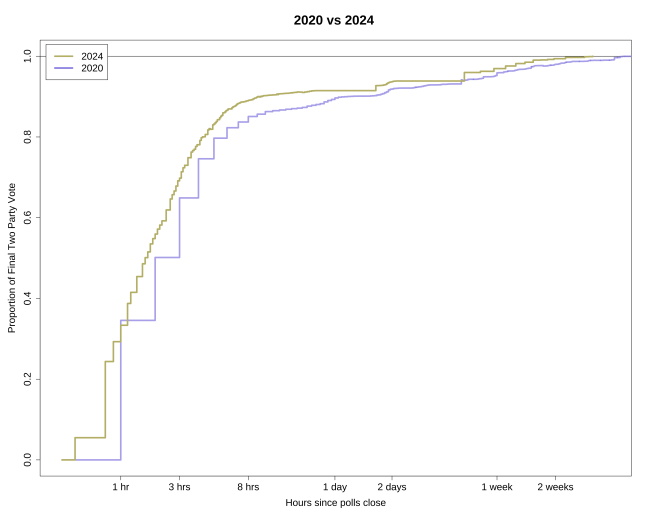
Figure 7: A comparison of nationwide vote counting speeds in 2020 (purple) and 2024 (gold) in the hours, days, and weeks after the election, compressed onto a single logarithmic x-axis. 2024 data are from Edison Research and collected from CNN, 2020 data are from the Associated Press and collected from the New York Times.
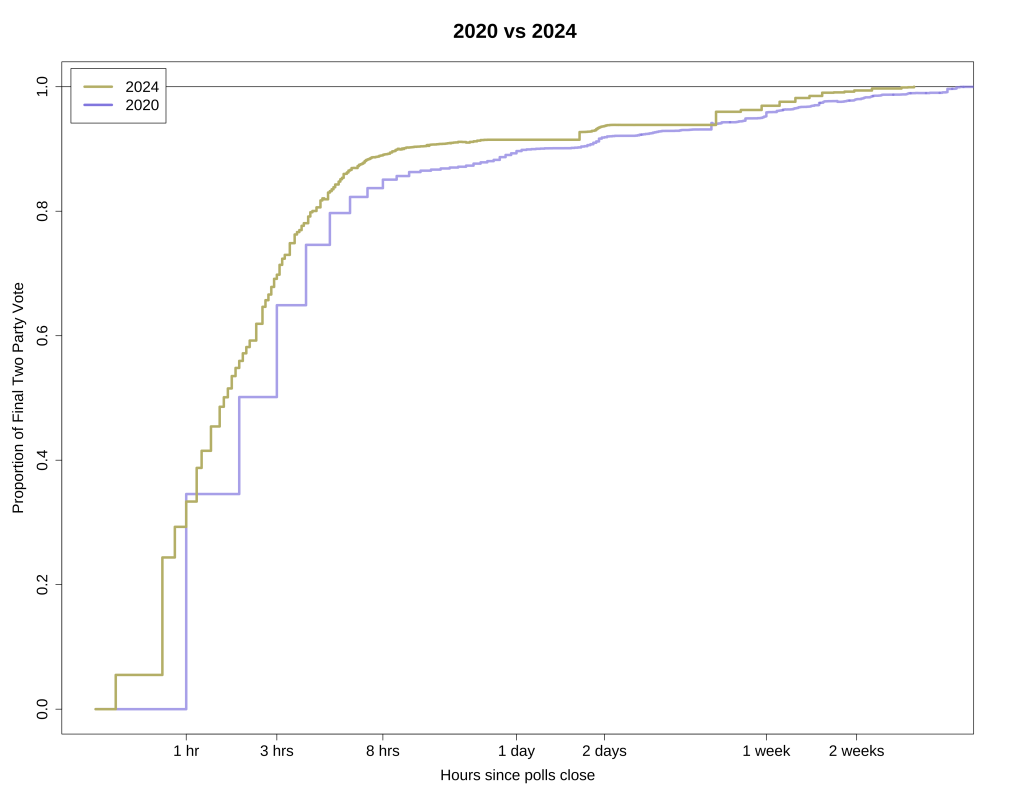
Figure 7: A comparison of nationwide vote counting speeds in 2020 (purple) and 2024 (gold) in the hours, days, and weeks after the election, compressed onto a single logarithmic x-axis. 2024 data are from Edison Research and collected from CNN, 2020 data are from the Associated Press and collected from the New York Times.
The relatively small but persistent gap between the 2024 and 2020 vote counts, with the 2020 proportion lagging by less than 10 percentage points for several weeks, is consistent with the finding that vote counting speed was connected with the volume of mail-in votes and certain procedures regarding when they can be counted. This gap was large enough, in enough close states, that major media organizations did not identify the presidential contest winner for about four days. Table 1 shows how the pace of vote counting in seven battleground states compared across 2020 and 2024: the number of hours represents how many hours passed before 95% of the two-party presidential vote had been counted in that year.
State | Hours in 2020 | Hours in 2024 | Factor increase 2024/2020 |
Arizona | 73 | 147 | 2.01 |
Georgia | 18 | 5 | 0.28 |
Michigan | 17 | 9 | 0.53 |
Nevada | 159 | 51 | 0.32 |
North Carolina | 3 | 6 | 2.00 |
Pennsylvania | 49 | 8 | 0.16 |
Wisconsin | 8 | 9 | 1.13 |
Table 1: The number of hours to count 95% of the two-party presidential vote in seven battleground states from 2020 and 2024. The numbers may be overstated by the duration of the media reporting process, plus up to half an hour, since they reflect when we collected the first data update that passed 95%, but up to half an hour may have passed between that update being posted to the website and our observing that update.
Pennsylvania, Georgia, Nevada, and Michigan saw speedups in the time to count 95% of the two-party presidential vote, ranging from about one fifth as long to about half as long in 2024 compared to 2020. In Wisconsin, it took a similar amount of time after the two elections. In North Carolina, it took about twice as long to count 95% of the vote, but the actual difference was small, only increasing from 3 hours to 6 hours. As Figure 1 shows, that remains an unusually fast pace for a state of its size. Arizona is the only state with a notable slowdown, taking about twice as long (almost three days longer) to count 95% of the two-party presidential vote in 2024 than it had in 2020.
Conclusion
An unusually slow vote count in 2020 was caused by the unique circumstances of that year’s global pandemic. In 2024, the vote count was much faster. Nearly all states had counted nearly all of their votes within a day of polls closing, with only about half a dozen states taking between two and ten days to count most of their votes. Some of these states, such as Washington, Nevada, Utah, and Arizona, tend to have relatively large proportions of votes cast by mail, but other states that were slower to report include Alaska, Mississippi, Maine, and Massachusetts. California stood out for the proportion of its vote that was reported in the weeks after Election Day, with about one third of its total vote updated incrementally each day over the course of about a month, while Florida and Texas stand out as very large states that counted and reported nearly all votes cast within 24 hours of polls closing. Out of seven major battleground states, four saw dramatic increases in vote counting speeds compared to 2020, and two saw little change, which made it possible for major media outlets to promptly identify the winner.
