Measuring and Managing Splits in Election Administration
America’s multilayered system of governments and administrative jurisdictions creates some of the most complex combinations of ballots among Western industrialized democracies, with the U.S. Census finding over 89,000 governmental sub-state governments.
The Issue
Proper representation and administration of these local governments depend on the fair administration of elections. However, most of these governments are not perfectly nested within each other, necessitating potentially thousands of different ballots to account for the variation.
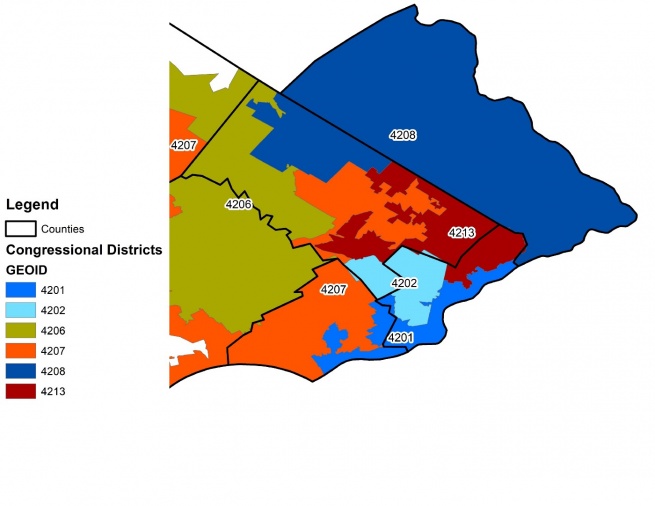
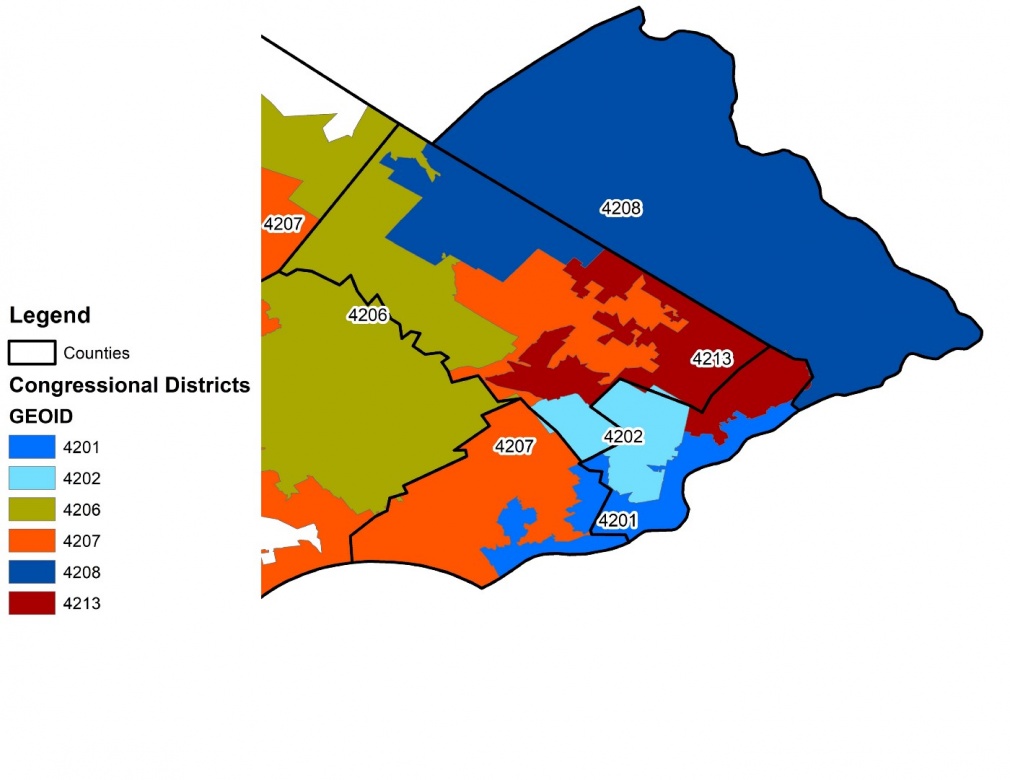
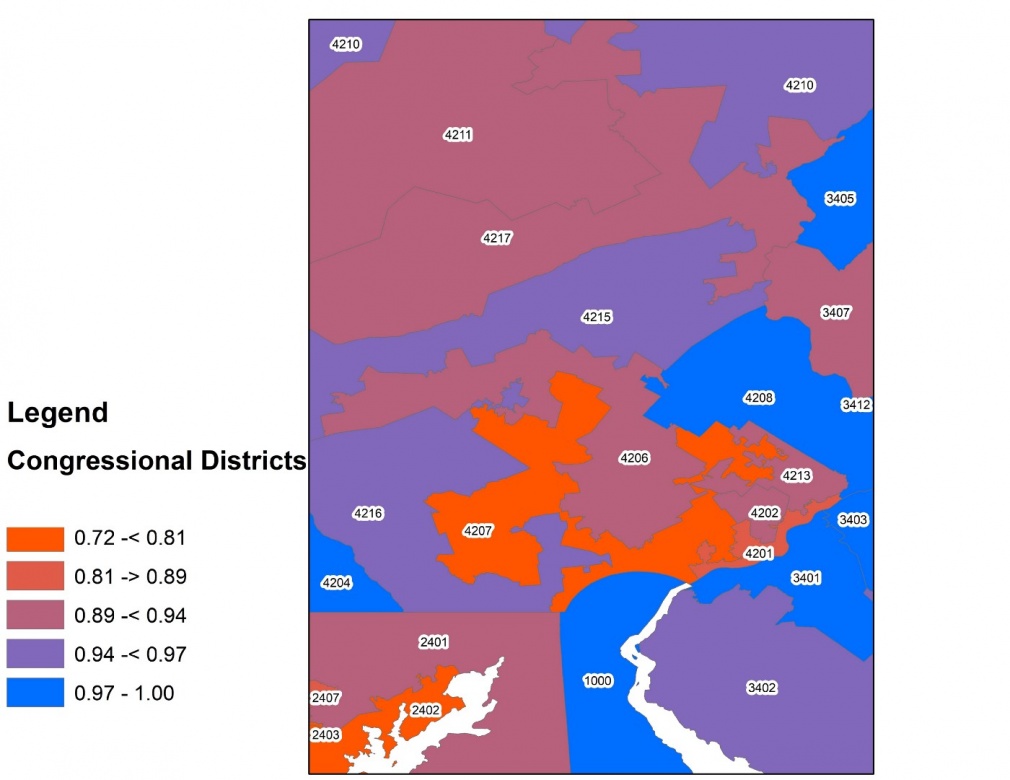
As an illustration of the problem, consider the Congressional districts around the greater Philadelphia area from 2016. The counties in charge of ballot design would need to assign voters under their jurisdiction the correct ballot item for Congressional district, with potentially several different Congressional races. However, the problem would not end there, as the county would in turn need to consider how these varying Congressional districts overlay with state legislative districts, school districts, and more.
To make matters worse, most states and localities are not adequately equipped to cope with these misaligned boundaries. Though these issues could be dealt with via accurate coordinate Geographic Information Systems (GIS) data, only several states as of 2019 have made significant headway in integrating GIS data into elections.
Most states and localities instead make use of databases with different types of identifying features, such as counties, precincts, ZIP codes, and streets, all of which might also be prone to imprecision due to outdated mapping techniques. When election administration officials cannot correctly assign voters the correct ballots, it can lead to potentially disastrous consequences in election outcomes, such as the misassigned voters in Virginia that changed two state legislative races, or in Georgia where 400 misassigned voters led to an election do-over.
Not all states are equal in the degree of split geographies and ensuing election administration problems, and the upfront costs to better integrate GIS data into elections can be expensive. Therefore, it is crucial for states and localities to know the extent to which splits might negatively impact their ballot assignment and ensuing confidence in elections.
Therefore, I developed a Python toolbox and an R script to determine the population overlap between two levels of geography, and the degree of accuracy that one could have in assigning voters to a district knowing only some polygon grouping of voters, such as ZIP Code Tabulation Areas (ZCTAs) or precincts. The script works by overlaying two levels of geography of interest onto Census tabulation data in the form of blocks or block groups.
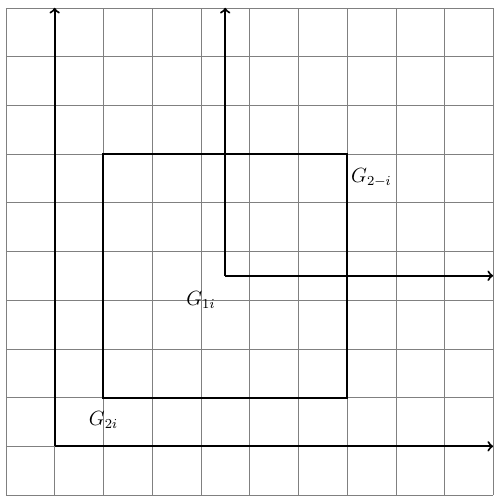
Figure 2, above, presents a simplified illustration between two levels of geography overlaid on top of a grid representing census blocks. Weights in the form of population are assigned to each block, which is useful in avoiding the assumption of a uniform population distribution that would arise if one calculated the geographic overlap.
Next, in order to calculate the severity of the misaligned geographies, past research looks to the number of higher-level geographic units splitting some lower level, such as congressional districts splitting precincts. However, not all splits are equal. A precinct evenly divided between five districts would be worse than a precinct where one district comprises nearly all of a precinct’s population, with the other four each containing one individual from the precinct of interest.
A measure to use that combines information on splits and population would be the Herfindahl index, where one takes the sum of squared split-populations within the lower level unit. Scores approaching a value of one are perfectly split, and those approaching zero nearly perfectly divided.
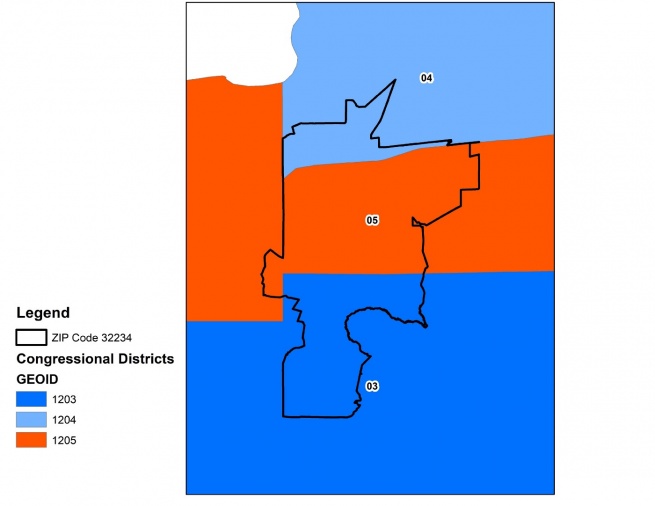
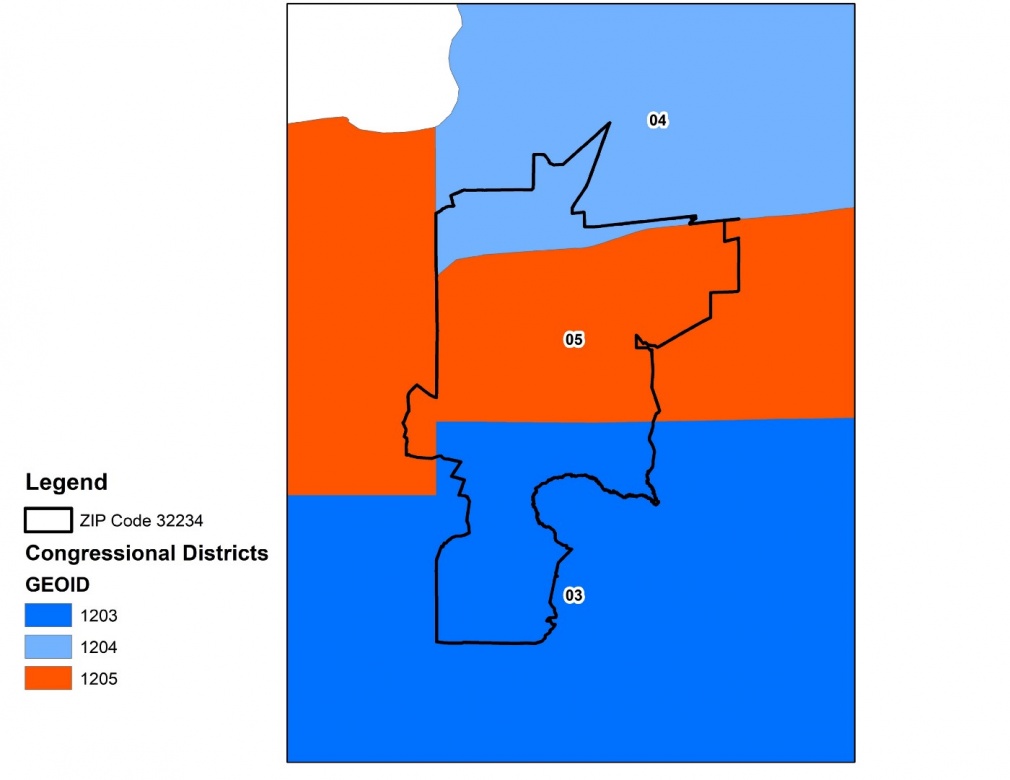
For example, a precinct divided by two districts where half of the precinct’s population lives in each would equate to 0.5² + 0.5², for a value of 0.5. A district split where 75 percent of the population lives in one district, and 25 percent the other, then the Herfindahl index would equate to 0.75² + 0.25², for a value of 0.625. An immediate value of the Herfindahl index and population overlap for election administrators is a cleaner visual of the potential problems in ballot assignment that arises from splits. Figure 3 presents Florida’s ZIP Code 32234, which is divided between three congressional districts. ZIP codes are of interest as a small unit of geography that might be used to match and contact voters for election administrators, along with research suggesting that splits lead to voter confusion about their representatives.
We see that the ZIP code is divided between the three districts, but if we sought to know the severity of the population discrepancies, we would need to overlay census blocks or block groups. At a certain point, the map would become unreadable, especially if zoomed out. The overlay method for administrators to identify residences affected by splits will be necessary for ZIP code by ZIP code, or precinct by precinct visuals, though distracting when trying to visualize multiple lower and higher-level geographies.
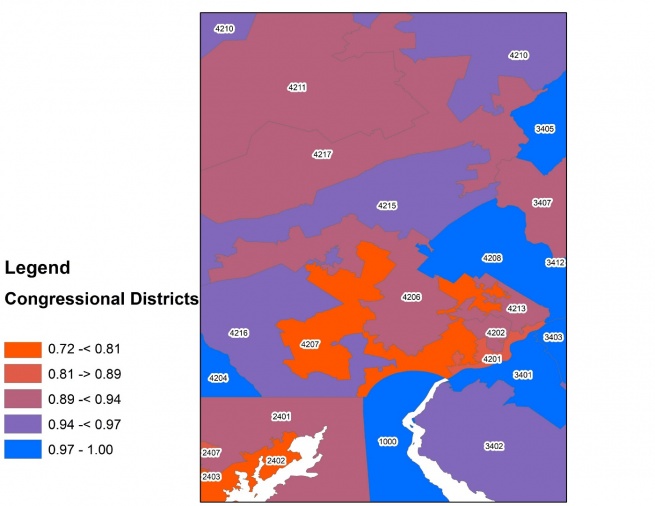
Figure 4 here presents the choropleth of ZIP codes surrounding ZIP code 32234, with red units reflecting ZIP codes divided up by congressional districts in such a manner that there is no majority of the population nested within a single district. Blue ZIP codes are those near-perfectly nested. Therefore, one can visualize the areas within a state, county, or some other level of geography, where splits between any two layers might cause confusion amongst voters and election administrators.
In the case of ZIP codes divided between multiple Congressional districts, election administrators could not simply inform all residents within a ZIP code of their member of Congress by using the simplified address. Rather, election administrators would need to know their precise address and overlay it on top of a congressional map.
Finally, one might be interested in knowing what proportion of the population could be matched to some higher-level district given knowledge of only one lower level of geography. If one then assigned entire units of the lower level of geography to the higher unit that it has the most overlap with, the resulting proportions would inform one as to how seriously the misalignment aggregates up into causing inefficiencies in election administration.
Figure 5 below presents these results by ZIP codes to congressional districts around the Philadelphia area for districts in place during 2016. Districts of a red hue reflect areas where there is greater imprecision between districts and congressional districts, whereas blue areas those districts comprised entirely of perfectly nested ZIP codes. As can be seen, the districts around Philadelphia are comprised largely of split ZIP codes, leading ZIP codes to be far from sufficient as a means to match voters to their representatives. In Pennsylvania’s seventh district alone, over 200,000 residents would be improperly assigned knowing only ZIP codes. Because election administrators need to match all voters without error, it is evident that far more information and time is necessary for them to complete their jobs.
How to use this information?
Fortunately, states across the country are now implementing precise coordinates into election databases. However, because efforts are still early in implementing GIS data into election databases, population overlap and measures of misalignment between geographies can be used in a few ways.
First, it can be used to identify areas within states most prone to mismatched ballots. If non-nesting of districts, precincts, ZIP codes, and more are split, then there is presumably an increased likelihood of error in these areas. If these potential hotspots are able to accurately and efficiently administer elections, it would only be through great time and effort by election administration personnel. Therefore, these areas high on the Herfindahl index and home to increased splits likely need more aid from the state in order to run elections.
Additionally, information as to the severity of splits can be used in combination with the states that have so far implemented GIS technology into election administration. If it can be shown that the new implementation of precise coordinate data aids in accurate ballot assignment given the severity of splits, these data could be used to demonstrate expected savings and ballot assignment accuracy in states yet to adopt more advanced GIS techniques.
Finally, with the 2020 redistricting cycle around the corner, some states might also consider splits and the ensuing inefficiencies that arise in election administration as a means to better nest geographic units. Even in the event that units such as counties need to be split in order to maintain population equality, that does not mean that precincts and ZIP codes need to be split. Because splitting ZIP codes already causes confusion among voters as to who their representative is, and split precincts incur costs to election administration, it might even be argued that misaligned geographies purposefully done to ensure political gain constitutes direct and individualized harm.
As maps and election administration currently stand, there is much room for improvement in cost- and time savings necessary to conduct elections. As recently stated by the Kentucky Executive Director of Elections, Jared Dearing, at the Elections Geosummit on August 14 in Washington D.C., “Maps are the foundation to our democracy. If I can’t tell where you live, I can’t tell you who represents you.” Therefore, it is crucial for us in the field of election administration to ensure that geography does not get in the way of representation.
