Oz and Fetterman: Duking it out 'til the Twitter end
A significant part of the highly contentious race for one of Pennsylvania’s Senate seats has occurred in an unlikely place and in an unusual format.
After suffering a stroke just days before the Pennsylvania primary election, current lieutenant governor and Democratic candidate John Fetterman took a break from the campaign trail to recover. In his physical absence, he migrated much of his campaign activity to Twitter, and for months he posted memes highlighting and mocking the shortcomings of his Republican opponent, the former TV personality and cardiologist Dr. Mehmet Oz. In turn, Dr. Oz responded with equally aggressive online fervor.
Here at the MIT Election Data and Science Lab, we have developed tools to analyze and scrutinize trends on social media, particularly on Twitter. I decided to apply these tools to this Senate race, where Twitter and meme-making has taken center stage, by quantifying and understanding the patterns in these candidate’s tweets. In conducting this analysis, I hoped to understand the role that tweets– and more specifically, memes– can hold in a race that has been so close and could become consequential beyond Pennsylvania’s borders.
I conducted this analysis in four steps:
- First, I scraped all of the tweets and replies to the tweets posted by John Fetterman and Dr. Oz from January to September 2022 using the Twitter API.
- Second, I quantified the use of keywords, or words I found were relevant to the campaign, in the replies to the tweets generated by these candidates.
- Next, I analyzed the sentiment of replies to these tweets to gauge how negative or positive they have become over time.
- Finally, I estimated the ideologies of the users who replied to the tweets to understand whether more negativity was coming from liberal or from conservative users, and whether that differed for Oz’s and Fetterman’s Twitter accounts.
Topics in Replies to Candidate Tweets
After combing through tweets and articles from the past ten months, I generated a list of “Oz-specific” and “Fetterman-specific” keywords, as well as words that I concluded were central to the campaign as a whole, such as “abortion” and “inflation.” I counted up the number of times these words appeared in the replies to the tweets for the respective candidate to gauge how the conversation evolved over time. The words associated with Oz, for example, include, “new jersey” or “nj” since Fetterman has repeatedly mocked Oz’s questionable Pennsylvania residency. I also tracked the word “crudité” over time since Fetterman highlighted an awkward video of Oz at the grocery store, where Oz laments Biden-driven inflation by demonstrating how expensive the purchase of ingredients for a crudité can be; Fetterman’s tweet sparked national laughter and Pennsylvanian indignation about Oz’s stunt.
The Fetterman-related words I tracked include “crime,” since Oz has frequently criticized his policies as being “lenient on crime,” and the topic has become central to the campaign as a key issue. Additionally, I tracked the words “health” and “stroke,” since Oz has made a particular point of claiming that Fetterman’s stroke contributes to his unfitness to serve. (For those interested in the full list of keywords, I’ve included it at the end of this post.)
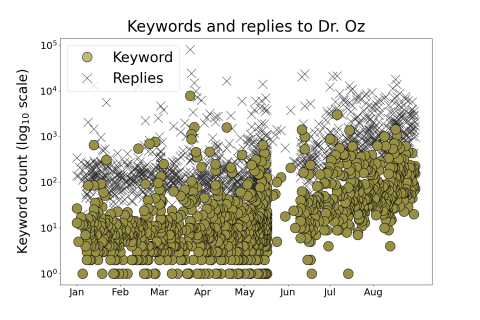
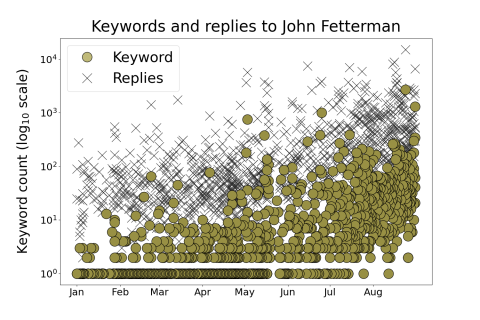
To begin our analysis, we’ll first look at two plots, which show the incidence of all of these keywords from January to September 2022 for both candidates.
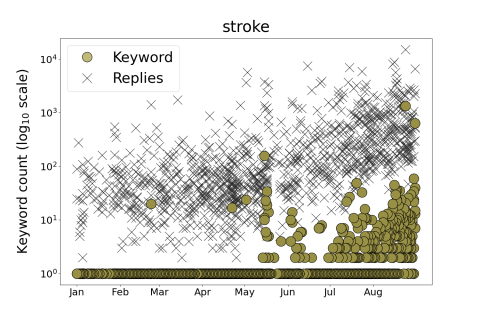
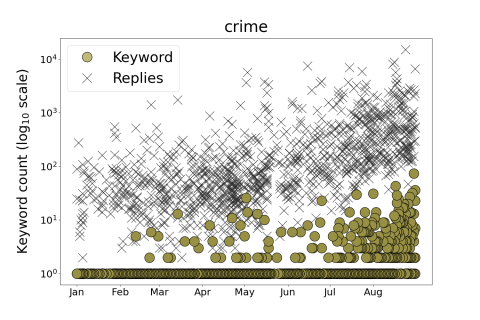
These plots are populated with “Xs,” which show the number of replies to a given tweet, and gold dots, which show the number of keywords which appear in the replies to that tweet. Looking at the plots, we see an increase in the number of keywords and the number of replies over time for both of the candidates. The increase is particularly noticeable after late June and July, when Fetterman ramped up his inflammatory content towards Oz. On the other side of the race, Oz took a break from tweeting for a substantial period after the primary election but picked up again, seemingly, as a response to Fetterman’s anti-Oz push during mid- to late July.
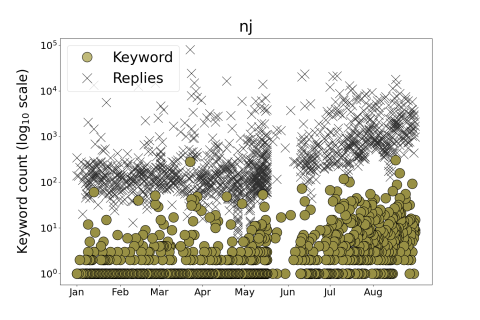
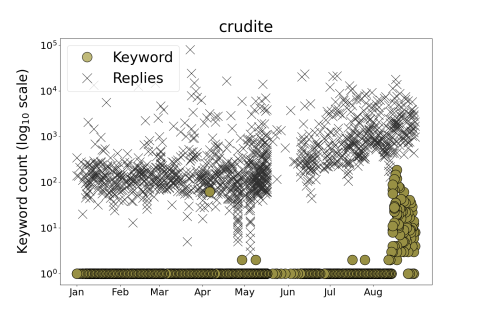
In another pair of plots, shown below, we can see just how use of the words “nj” and “crudité” have increased over the course of the campaign. As Fetterman raises specific images to public consciousness—for example, when he drew attention to the aforementioned grocery store crudité video in August, five months after it was originally posted in April—replies to Oz’s tweets spike with references to those images. In the “crudité” example, we can see that Oz’s tweets are flooded with replies using the word “crudité” around that time as a result.
The same phenomenon also happens in reverse. The below plots show how the words “stroke” and “crime” vary in the responses to Fetterman’s tweets. As we can see in the plot showing the incidence of the word “stroke”, there is an uptick in the number of responses with that word in May; unsurprising, as that is when he suffered his health scare. However, in late July and August, after Oz took painstaking actions to convince voters that Fetterman was in poor health, we see a definite uptick in this word in Fetterman’s replies as a result. Similarly, the word “crime” has a hefty incidence in Fetterman’s replies, in what one can imagine is a response to how Oz has painted him online in recent months.
In short, in both the Fetterman and the Oz plots, we can see the extent to which the other candidate has influenced the conversation on his opponent’s Twitter account.
Sentiment of Replies to Candidate Tweets
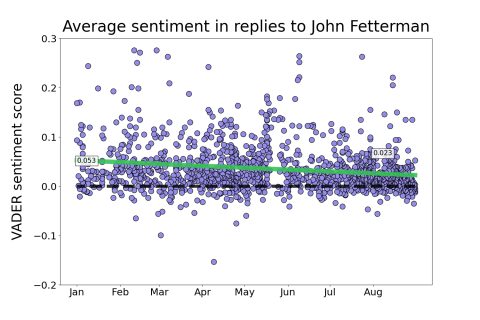
Moving past that baseline, I then analyzed the sentiments of the replies to the tweets, to understand whether those replies were becoming more negative or positive over time. Each point in the plot below represents each of the tweets that the candidates have made on their own accounts; the position of each point represents how negative or positive, on average, the replies were to that tweet. I have also included an Ordinary Least Squares line, or OLS line, to show the trend over time. The scores for each tweet were calculated using the VADER package in python, which is a standard method for analyzing the sentiment of social media data.
These plots show us that the replies to Fetterman’s tweets are getting more negative over time, demonstrated by the more pronounced downward trend in the OLS line. Yet on average, Fetterman’s replies remain much more positive than Oz’s replies. Although Oz’s trend line is fairly flat, with a slight trend towards negativity, replies to his tweets have been consistently negative over time. Both plots show very distinct stories. The negativity in Fetterman’s replies increases over time but the level of sentiment is more positive overall, while Oz has a less dramatic, slightly negative trend over time that is markedly more negative on average.
Ideologies of the Repliers to Candidate Tweets
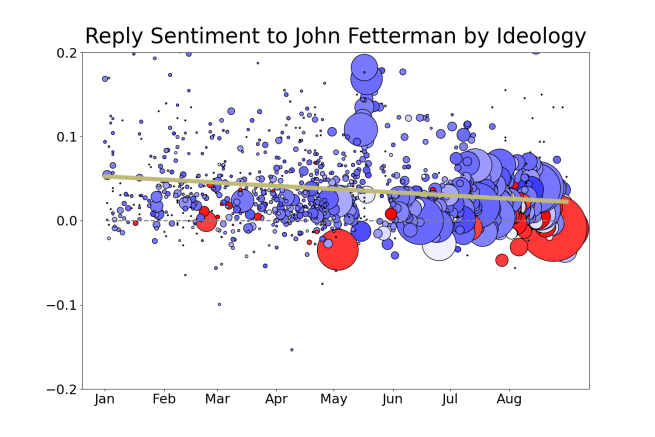
As the final piece of this particular analysis, I estimated the ideologies of the respondents to the candidates’ tweets to determine whether liberals or conservatives were more likely to respond with negativity to Oz and to Fetterman, and how that differed between the candidates. To do so, I generated ideology scores based on a package developed by Pablo Barberá in 2017, which determines if a given user is more likely to be liberal or conservative based on who that user follows.
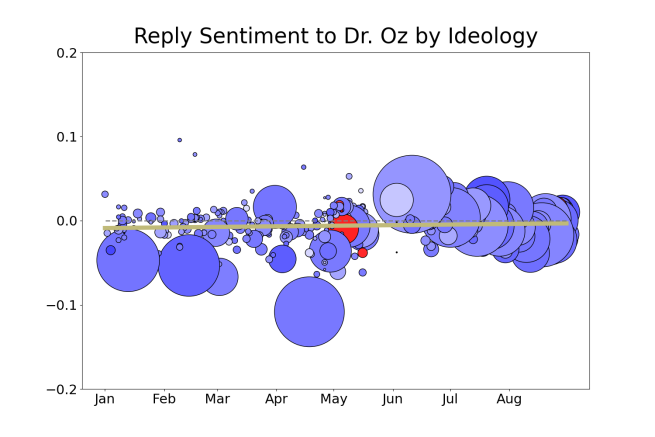
The plot above shows the resulting ideology scores of Fetterman’s repliers. Each point represents a tweet sent by Fetterman. The color of the point represents the median ideology of the respondents to the tweet, the y-axis indicates the average sentiment of the replies to the tweet, and the size of the point represents how many replies that tweet received. The plot shows that while Fetterman receives replies from both liberals and conservatives, liberal users make up most of the replies. In this case, liberal users are also more likely to generate positive replies, while conservatives are largely responsible for leaving negative comments on Fetterman’s account. Additionally, the plot shows that the number of repliers went up markedly after the primary election and increased during the summer, as the points get larger and larger over time. Overall, Fetterman’s plot describes the polarized environment we might expect: positivity driven by users of a like-ideology and negativity driven by those across the aisle.
The next plot demonstrates the reply sentiment to Dr. Oz’s tweets by ideology. Surprisingly, it is almost a polar opposite from the trends we see in Fetterman’s plot, but not in the way we might expect. Oz’s plot shows us almost exclusively liberal replier activity with occasional responses from conservatives. Dr. Oz receives overwhelmingly negative tweets on average, which is consistent with the fact that he mostly attracts replies from liberal users. This begs the question: why is Dr. Oz less likely to attract respondents from users of a similar ideology? One explanation that we can discount is that the population of users who reply to candidates on Twitter are overall liberal; Barberá shows that the population of American Twitter users does not overwhelmingly lean one way or the other, and in Pennsylvania, a swing state, there is no reason to think repliers would come from just one side of the ideological spectrum. While the particular question of why Dr. Oz attracts mostly liberal respondents is outside the scope of my analysis here, it would be an interesting question for a researcher to pursue.
Conclusion
The Fetterman-Oz Twitter war has highlighted a relatively new front on the campaign trail. Memes are in some ways the new TV-campaign ads, where slandering one’s opponent is couched in being cheeky, clever, and with the aim of going viral. By analyzing the replies on the accounts of these candidates’ Twitter pages, we can begin to see the reflection of these memes and messages in public response and reaction. Whenever the candidates highlight their opponent’s perceived shortcomings – whether that be questioning his health or his attempt to make a metaphor out of a crudité – the public conversation refocuses sharply towards those topics, demonstrating the effect these posts and tweets have on what becomes salient to the campaign, and to the media coverage of the race.
Analyzing the replies also shows us that sentiment toward Fetterman’s account has grown more negative over time but remains far more positive than Oz’s, who has consistently drawn negative fire over the past year, far before this particular Twitter war began. The users who are driving up the negativity tend to be conservative users on Fetterman’s page and liberal users on Oz’s page– yet Fetterman also receives positive replies as well, with support coming from those with his same ideological leaning. Oz, on the other hand, does not attract much attention and reply-activity from conservative users, leaving his replies mostly filled with negativity from liberal users.
Does the Oz-Fetterman Twitter war provide a blueprint for what to expect of campaigning in the future, or is this simply a fluke between an unlikely and frankly entertaining matchup? Only the impending election will tell…and we’ll be watching to see what happens!
Appendix
Below is a list of words used in the keyword plots for this analysis. The words are separated by Fetterman- and Oz-specific words.
|
John Fetterman |
Mehmet Oz |
|---|---|
|
abortion |
nj |
|
criminal |
new jersey |
|
crime |
resident |
|
health |
abortion |
|
fake |
fake |
|
stroke |
hollywood |
|
violent |
joke |
|
inflation |
outsider |
|
pro-murder |
safe |
|
outsider |
trump |
|
safe |
ban |
|
soft |
crudite |
