Partisan Gerrymandering, Clustering, or Both?
A New Approach to a Persistent Question
What is the impact of current redistricting practices on the partisan makeup of the U.S. House of Representatives? This question has inspired decades of research in political science, producing mixed results. The newest paper on the topic, which is co-authored by Richard J. Powell at the University of Maine, Matthew P. Dube at the University of Maine at Augusta, and me, seeks to provide a fresh perspective to a subfield of election science that has re-emerged into the limelight following recent supreme court cases on gerrymandering.
Why does there need to be more work?
With the rise of geographic information system (GIS) technology, redistricting has become more salient in the popular sphere and the academy. This has led to several excellent studies on gerrymandering and redistricting in the past few years, with the creation of metrics such as the efficiency gap, mean-median difference, declination, and the development of simulation-based techniques such as Bayesian graphical frameworks, geometric-based simulations, and frequentist graphical frameworks to evaluate districts and entire district maps.
While each of these techniques serves as an important contribution to our understanding of redistricting, each also has conceptual or theoretical limitations, which future work will need to address. This does not detract from any individual study, but is simply an artifact of the incremental nature by which knowledge is advanced.
In our study, we sought to advance the field in two ways. First, we wanted to create simulated districts in a way that is more grounded both in theory as well as in the choices and requirements facing those involved in re-drawing districts. Second, while the sorting hypothesis (that district homogeneity, and thus the increased partisan polarization entrenchment within any given district, is due to population sorting) has often been proposed as the reason that the measured impact of redistricting on the partisan composition of Congress is light, we are the first to test it directly using simulation-based techniques.
Testing the impact of redistricting on district homogeneity
First, we sought to test the impact of current redistricting practices on district homogeneity.
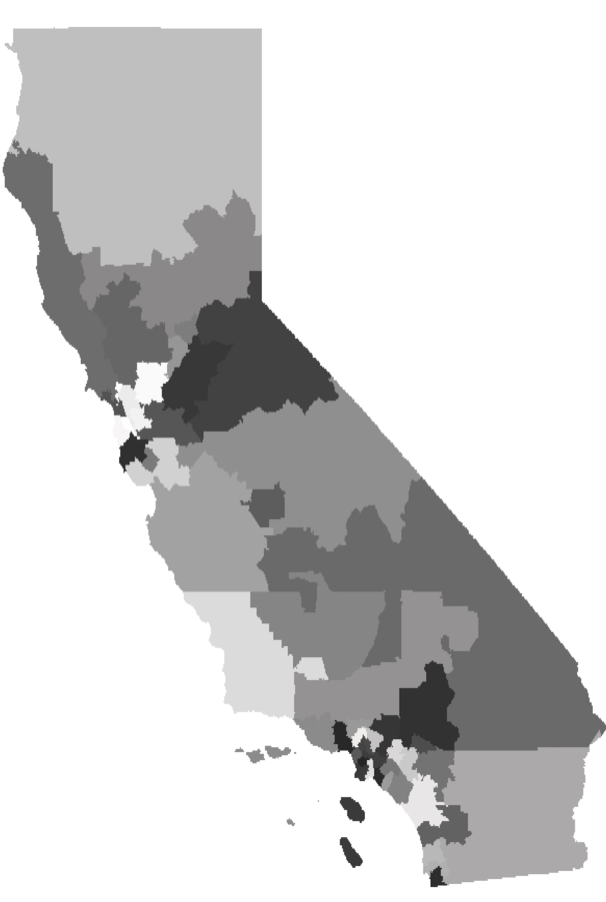
We simulated 100 district maps for each state using gpMetis, an algorithm that can be used to implement graph theory to partition a shapefile into districts based on a population parameter. This algorithm is very fast: a full district map of California can be drawn in 4 seconds, allowing us to create arbitrary numbers of district maps. We did this in a way that employed rook connectivity; without it, graph theory simulations will create districts that actually cross each other, an impossibility in actual redistricting.

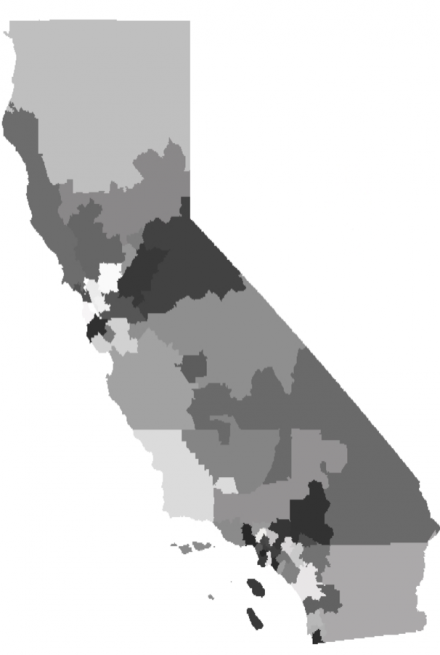
A map of potential congressional districts in California created by the gpmetis algorithm.
Next, we calculated the Sullivan Diversity Index for the actual and simulated districts, and compared them according to their rank-order (most diverse actual district compared to most diverse simulated district) to test the impact of redistricting on district homogeneity. The Sullivan Diversity Index has been developed at least twice; first, by statisticians and ecologists in the 1940s, then borrowed for the study of American politics, and then by Comparativists for studying ethnolinguistic fractionalization (ELF) in the early 2000s.
Testing the impact of redistricting on the partisan makeup of Congress
The second analysis sought to gain leverage on the impact of redistricting on the partisan makeup of Congress. This also took several steps due to various hurdles. First, we used “even swing” to create a national precinct map. To do this, we simply used county-level presidential returns from 2012 and pushed them down to the VTD level using the 2008 precinct results map. We then used this file to draw 1000 district maps in every state using gpMetis. Votes were aggregated to the district level in each simulation, which allowed us to compare the partisan composition of real and simulated Congressional districts nationwide.
Results—what did we find?
We came to several conclusions. First, while there are significant levels of sorting along demographic lines in the United States, we find that gerrymandering and current redistricting practices do cause an increase in district homogeneity in the United States, well beyond what would be expected simply by demographic sorting alone. Second, this sorting only accounts for between 1–4 seats for the Republican party. Third, we find that current redistricting practices — including gerrymandering, intentional drawing of majority-minority districts, using legacy districts as starting points, and other practices — combined to provide the Republican party a 16-seat advantage in Congress following the 2012 election.
Future work
Just like the studies on gerrymandering and redistricting that came before this one, our study is incomplete and leaves potential areas for future study and improvement.
First, it highlights the need for an open-source precinct map at the national level, which I detailed in a previous blog post. This would prevent the need to use “even swing,” and would improve accuracy.
Second, more work needs to be done on the various simulation algorithms, and how they compare to each other. What assumptions are they making? Where do they do well or perform poorly?
Finally, more work needs to be done to include constraints imposed by the Voting Rights Act and other districting requirements into the algorithms themselves, to build simulated districts that would likely be likely able to survive a court if they were implemented.


