How Data Can Inform the Elections Resource Allocation Problem
The MIT Election Data and Science Lab helps highlight new research and interesting ideas in election science, and is a proud co-sponsor of the Election Sciences, Reform, & Administration Conference (ESRA).
Our post today was written by Rachel Orey, based on her presentation at the 2021 ESRA Conference . The information and opinions expressed in this column represent their own research, and do not necessarily represent the opinions of the MIT Election Lab or MIT.
If you'd like to learn more about this work, you can read the full Bipartisan Policy Center report here.
Both the beauty and the challenge of United States elections lies in their versatility.
This country is home to thousands of local election jurisdictions, each with distinct electorates and diverse approaches to election administration. A one-thousand-person township in central Maine has the same goal as a multimillion-person county on the coast of California: to provide a free and fair election to every eligible voter. While voters in one jurisdiction may prefer to vote entirely by mail, voters in another could lean heavily towards in-person options. Another jurisdiction might see voters evenly divided between mail, early, and Election Day voting, creating a logistical nightmare for election officials who must balance limited resources between each voting method.
The multitude of approaches to election administration at the local level creates a problem for policymakers striving to set uniform standards for how election resources should be allocated. Is it better to pour resources into mail or in-person voting? If we put more resources towards Election Day voting, can we reduce the number in-person early voting sites in exchange? Should every jurisdiction have the same voting methods available?
Recognizing the need for a baseline of minimally acceptable voting options, as well as the need to more efficiently distribute limited elections office resources, we propose a versatile Resource Estimator that determines how resources should be allocated based on a jurisdiction’s voter preferences and election laws. Understanding that no single allocation of voting options could suit every jurisdiction, the Resource Estimator acknowledges the need for both standardization and adaptability. It offers a standard formula for allocating resources that applies across the country; this standard formula is then adapted to a jurisdiction’s individual circumstances.
Methodology
An April 2021 Bipartisan Policy Center and Morning Consult survey found that 80% of registered voters—91% of Democrats and 72% of Republicans—were satisfied with their voting options in 2020. This report is built on the premise that if most voters were satisfied with their voting options in 2020, it can therefore be assumed that the supply of voting options at large in the 2020 general election sufficiently meet voters’ needs. This research operationalizes the minimally acceptable level of voting options as that which best fits what was offered across the country in 2020.
This report uses data from the Election Assistance Commission’s Election Administration and Voting Survey (EAVS). We merged the 2016 and 2018 standard EAVS survey with the 2018 EAVS policy survey to identify trends in the allocation of voting options. From those trends, we developed a set of formulas that determine the minimum number of early voting and Election Day voting sites and poll workers a jurisdiction needs based on their voters’ preferences and mail voting policies. We applied Ordinary Least Squares (OLS) regression analysis to identify statistically significant relationships between voting options and voter behavior, ultimately proposing an approach that is both reliable and accurate, standardized and adaptable.
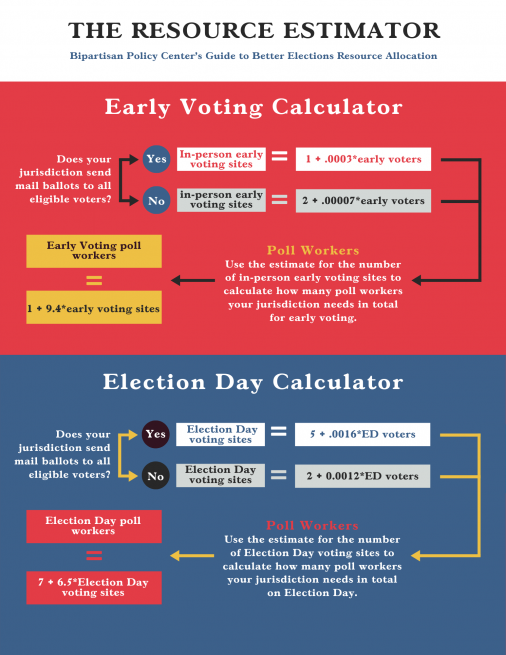
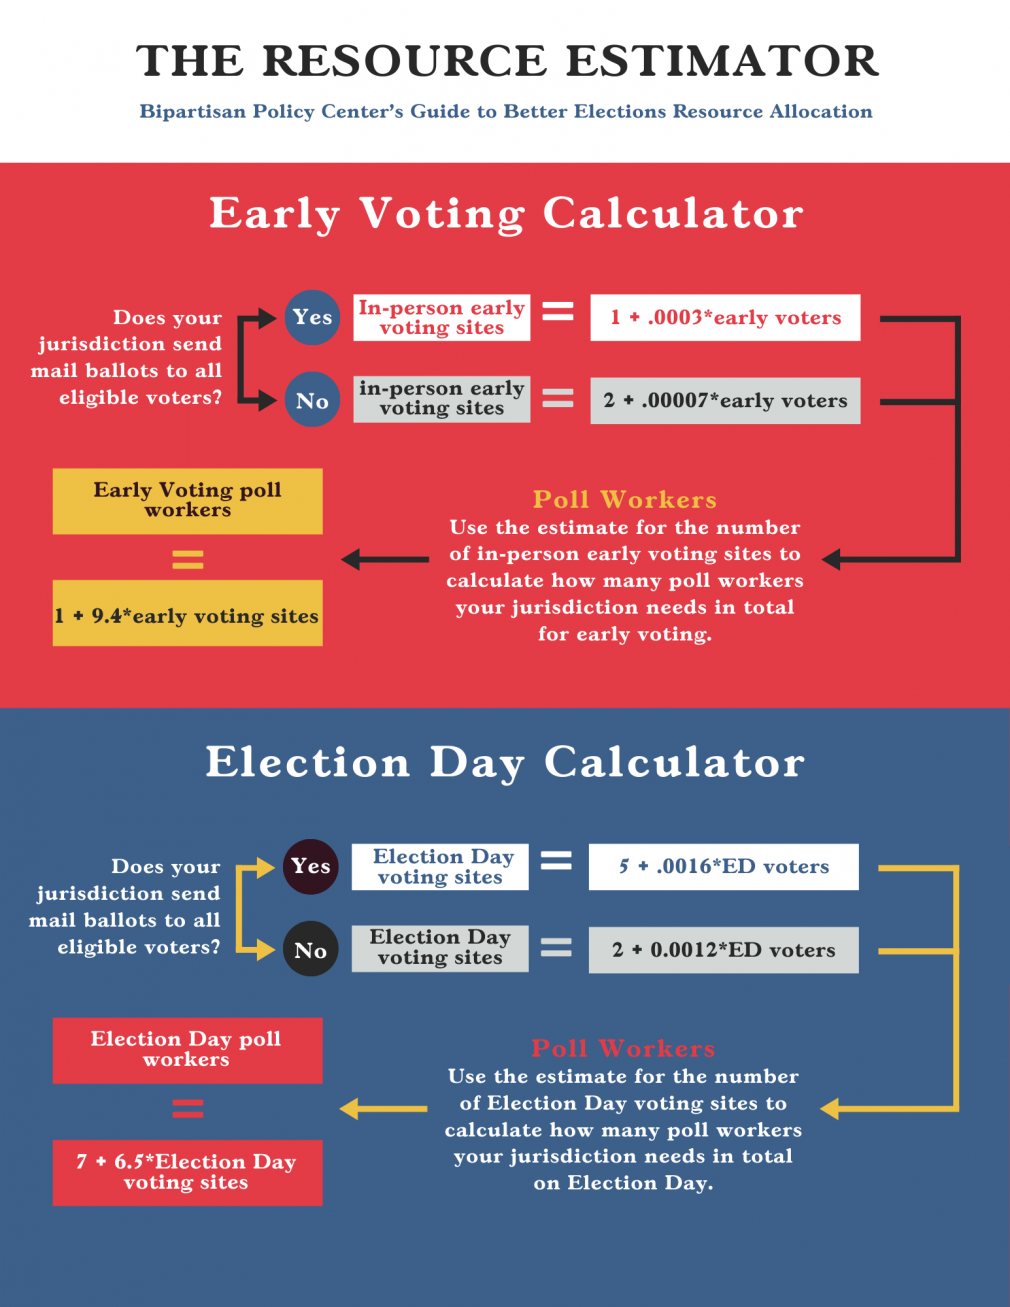
The below graphic summarizes the end result of the research. An interactive spreadsheet can be downloaded here to produce calculations more easily.
A more detailed methodology can be found with the full Bipartisan Policy Center report.
Visualizing the Relationship Between Policy, Resource Allocation, and Voter Behavior
The Resource Estimator is the product of multiple linear regression analyses that explored the nuanced relationships between individual voting options and voters’ behavior. Our findings confirm that election administration policies have an undeniable impact on voter behavior.
Early In-Person Voting: Voter Participation
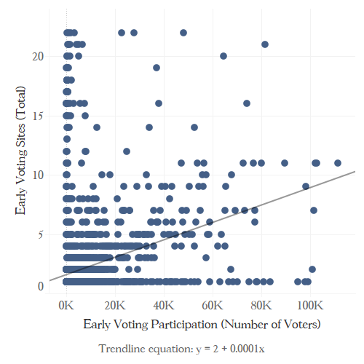
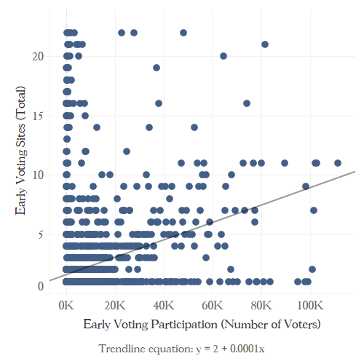
There is a clear, positive relationship between the number of early voting sites per jurisdction and the number of voters who participate in early voting. This model suggests that at large the minimum number of early voting sites any jurisdiction should have is two. Jurisdictions would then add additional locations based on the number of expected early voters (discounting each voter by 0.0001). For example, a jurisdiction expecting 60,000 early voters would have eight early voting sites: floor of two sites plus 60,000 times 0.0001.
This simple model hints at the transformative potential of data-informed decision-making in the allocation of election resources. The following analyses further flesh out this simple approach by incorporating additional variables that get at the distribution of voting options in a jurisdiction.
Early In-Person Voting: Incorporating Mail Voting Policies
Vote-by-mail jurisdictions have lower rates of in-person early voting than jurisdictions with traditional absentee voting. However, and somewhat deceptively, our analysis also shows that vote-by-mail jurisdictions have more in-person early voting sites available per voter than those without. This is likely caused by two reasons. First, jurisdictions with more expansive mail voting options tend to have lower rates of early voting, and thus there is less demand for each voting site. Second, this reflects a political culture in some areas that prioritizes more voting options as a public good, even if they are not as heavily utilized.
As the below figure depicts, there is a clear relationship between the number of early voting sites and a jurisdiction’s mail voting policy. As jurisdictions progress from absentee voting to vote-by-mail (in which a mail ballot is sent to all eligible voters), the number of early voting sites offered per early voter increases. Jurisdictions with more mail voting availability tend to offer more early voting sites per early voter, even if their total number of early voting sites is smaller.
Vote-by-mail jurisdictions require more than four times as many early voting sites per early voter as absentee areas. This unique contrast suggests that while vote-by-mail jurisdictions have lower rates of early voting, they need more sites per voter to meet demand. This makes sense when considering that each early voting site can only cover so large of a geographic area, capping the potential number of voters served by each site. While jurisdictions with higher early voting populations can serve more voters per site, jurisdictions with fewer early voters need more sites per voter (but fewer sites in total).
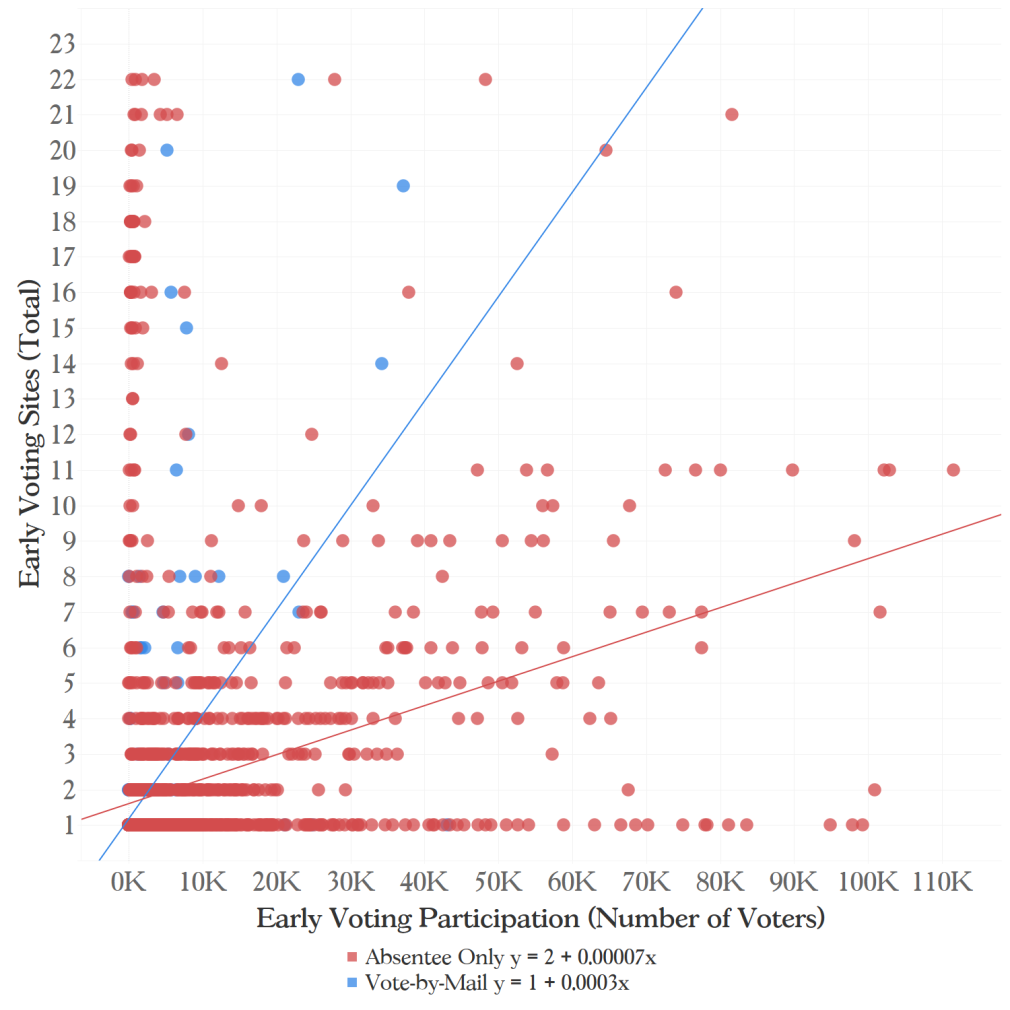
Figure 2: Early Voting Sites and Mail Voting Policy
Election Day Voting: Voter Participation
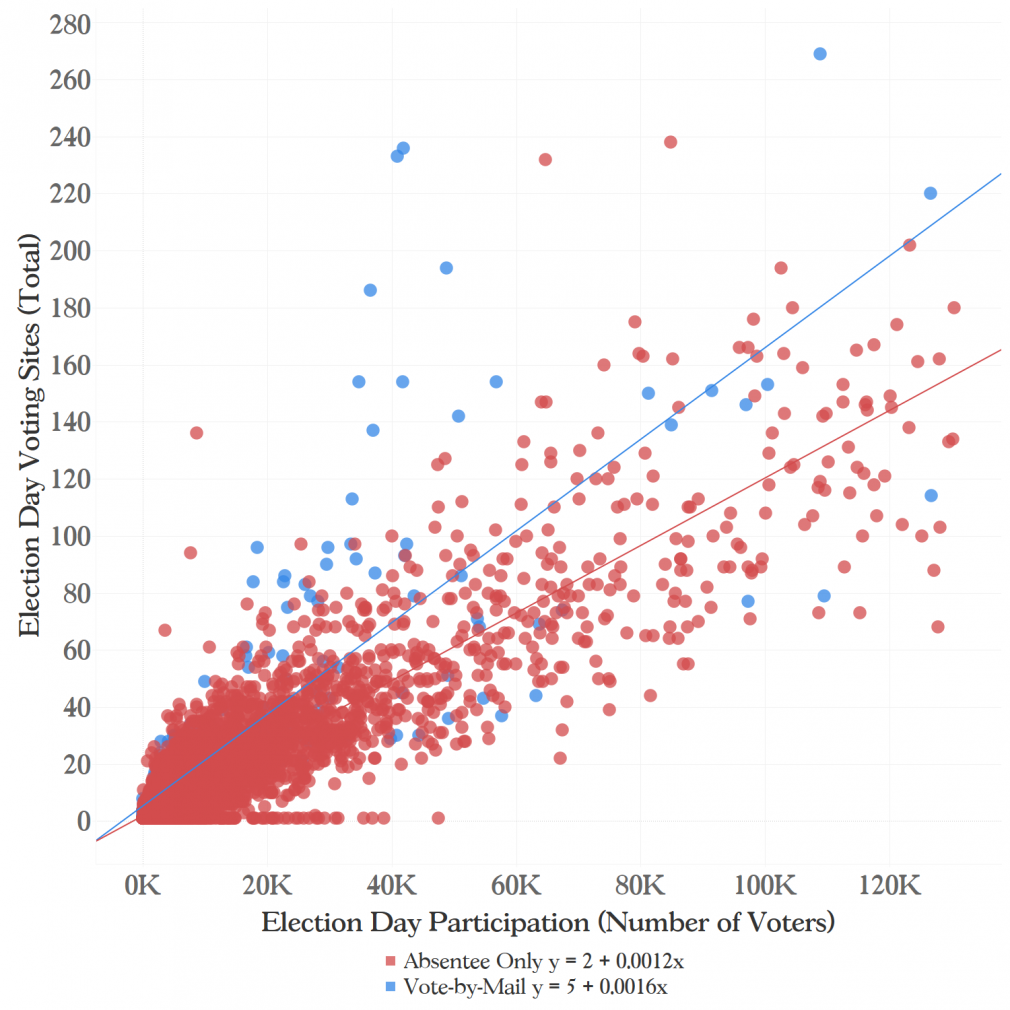
The number of Election Day voting sites a jurisdiction needs is highly dependent on the number of voters who choose to vote in-person on Election Day. Yet participation alone does not paint the whole picture. Incorporating the other voting options that a jurisdiction has available—namely, their mail voting policies—is crucial to identifying the minimum number of Election Day voting sites needed.
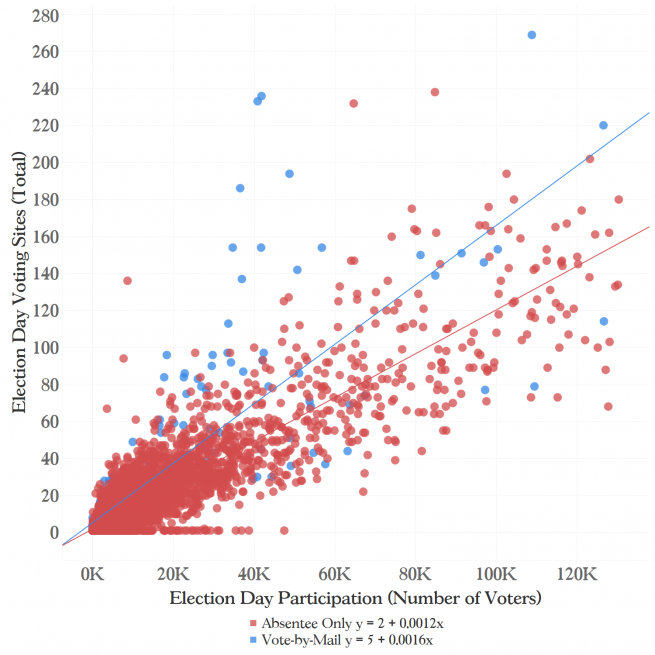
Figure 3 shows how a jurisdiction’s mail voting policy impacts the number of voters served per Election Day voting site. Similar to the trends we saw with mail voting policies and early voting rates, vote-by-mail jurisdictions tend to serve fewer voters per Election Day voting site than absentee-only jurisdictions. When voters have more options to vote before Election Day, fewer of the jurisdiction’s voters will vote in-person on Election Day.
Yet because a physical voting site can only serve so large a geographic area, early voting jurisdictions must offer more sites per voter in order to serve all voters in an equitable manner. Critically, the Resource Estimator allocates voting sites based on the number of voters participating in a specific voting option. Therefore, even though vote-by-mail jurisdictions need more sites per participating voter, because the number of voters participating in Election Day voting is lower they are likely need fewer sites in total than absentee jurisdictions.
Example: Applying the Resource Estimator to Two Hypothetical Jurisdictions
Consider two hypothetical jurisdictions, each with 100,000 active and participating voters:
- “Jurisdiction A” is a traditional jurisdiction that relies primarily on in-person Election Day voting. It does not send a mail ballot to all registered voters. Jurisdiction A expects 100,000 voters to participate in its upcoming election, with 30 percent of those voters likely to vote absentee and the remaining 70 percent to vote in-person on Election Day.
- “Jurisdiction B” recently introduced vote-by-mail and sends a ballot to all registered voters, in addition to offering in-person early and Election Day voting options. For its upcoming election, it expects 40 percent of its voters to vote by mail, 30 percent to vote early, and 30 percent to vote on Election Day.
|
|
Jurisdiction A |
Jurisdiction B |
|---|---|---|
|
Expected Number of Early Voters |
0 |
30,000 |
|
Expected Number of Election Day Voters |
70,000 |
30,000 |
|
Expected Number of Mail Voters |
30,000 |
40,000 |
|
Total Voters Participating in Election |
100,000 |
100,000 |
Based on these estimates for the number of voters participating in in-person voting options, the Resource Estimator produces the following values for the minimum number of voting sites needed for each jurisdiction.
This example highlights the different resource needs of jurisdictions, dependent on their mail voting policies. Both jurisdictions expect 100,000 voters to participate in the election, but while most voters in Jurisdiction A vote on Election Day, most voters in Jurisdiction B vote early or by mail. Given this disparity, there is no reason why both jurisdictions should have the same number of voting sites. The Resource Estimator captures this nuance and recommends that Jurisdiction A have more Election Day voting sites to meet voting demand. On the contrary, Jurisdiction B needs about 40 percent fewer Election Day sites because more of its voters are utilizing its early and mail voting options. Should Jurisdiction A implement more expansive mail and early voting policies, it could likely decrease the number of Election Day voting sites in use without negatively influencing voters’ access to the ballot.
This example also highlights the potential of the Resource Estimator to help election officials thoughtfully allocate limited voting resources. No jurisdiction in the United States is the same, thus a one-size-fits-all approach fails to account for the vastly different needs of a diverse voting population. The Resource Estimator is just the beginning of a modernized election administration system that promotes both equitable voter access and administrative efficiency.
Conclusion
We propose the Resource Estimator with a brief note of caution. Metrics such as these hold promise to standardize elections and promote voter confidence, but too often with rules-based policy those performing above the minimally-required level fall to the floor instead of continuing to rise above it. The Resource Estimator is intended to help jurisdictions manage hard trade-offs when allocating resources, not give states or localities an excuse to cut back voting options already being provided. Furthermore, we are wary of portraying our findings in a way that promotes false precision. Election officials should use the Resource Estimator to inform resource allocation questions, but it is critical that it be coupled with their own knowledge of their own jurisdiction’s specific needs and circumstances.
The debate on voting reforms must move away from extremes—in which more of everything is pitted against a wholescale reduction in convenience voting options—and meet voters where they are. The electorate will continue to change: voters in 20 years may have very different preferences about how to vote than they do today, just as today’s voters expect a different slate of options than voters 20 years ago. Election administration should not be static, and much work is needed to bring our electoral system into the modern age. Innovation is only possible if reallocation and evidence-based policymaking can flourish.
