How Do People React When They Encounter Problems While Voting?
The MIT Election Data and Science Lab helps highlight new research and interesting ideas in election science, and is a proud co-sponsor of the Election Sciences, Reform, & Administration Conference (ESRA).
Our post today was written by Logan Woods, based on his presentation at the 2021 ESRA Conference. The information and opinions expressed in this column represent his own research, and do not necessarily represent the opinions of the MIT Election Lab or MIT.
Interested readers can find the working paper at the link here.
Despite the recent expansion of voting by mail, millions of Americans continue to cast their ballot in person on or before Election Day. Recent elections have been overwhelmingly well-run and perceived as such (Stewart 2017; Stewart 2021), and state and local election officials act with integrity, but poor experiences at the polling place do occur. In a recent working paper, I explore if and how voters react to those problems during the election in which they occur.
Background
There is ample evidence that when potential voters encounter problems while voting there are consequences for their beliefs and actions in the future, from those who face long lines being less likely to vote in a future election (Pettigrew 2021; Cottrell et. al. 2020) to voters having less faith that their ballot was counted as they intended if they feel as though they had a negative experience with poll workers or while voting (Atkeson and Saunders 2007; Hall and Moore 2014 p. 182; King 2017; 2020). In addition, some people become angry or reactive when they encounter situations that might threaten their right to vote (Biggers 2021, Valentino and Neuner 2017).
These feelings of anger and reactance are likely to be a short term state, suggesting that if voters do react to problems while voting, that reaction may be more detectable in the short term—that is, during the election in which the problem occurs. The response to an Election Day problem should also depend on what people believe the source of the problem to be; for example, a voter who believes that the long line they encounter is due to high turnout will likely respond to a long wait to vote differently than if they believe the long line is due to a poorly-run polling place.
2019 Survey Experiment
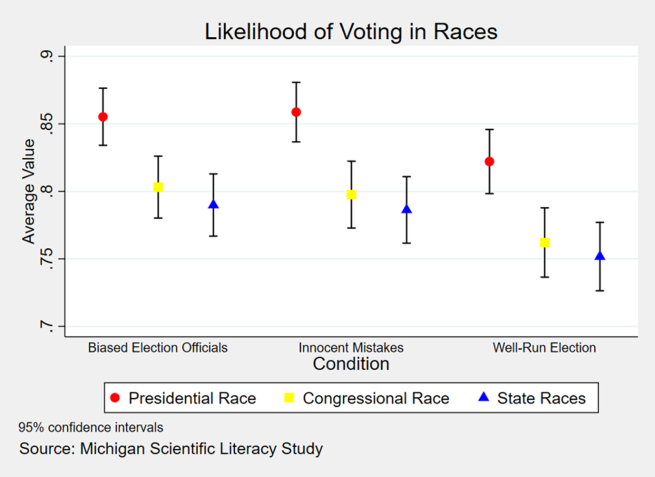
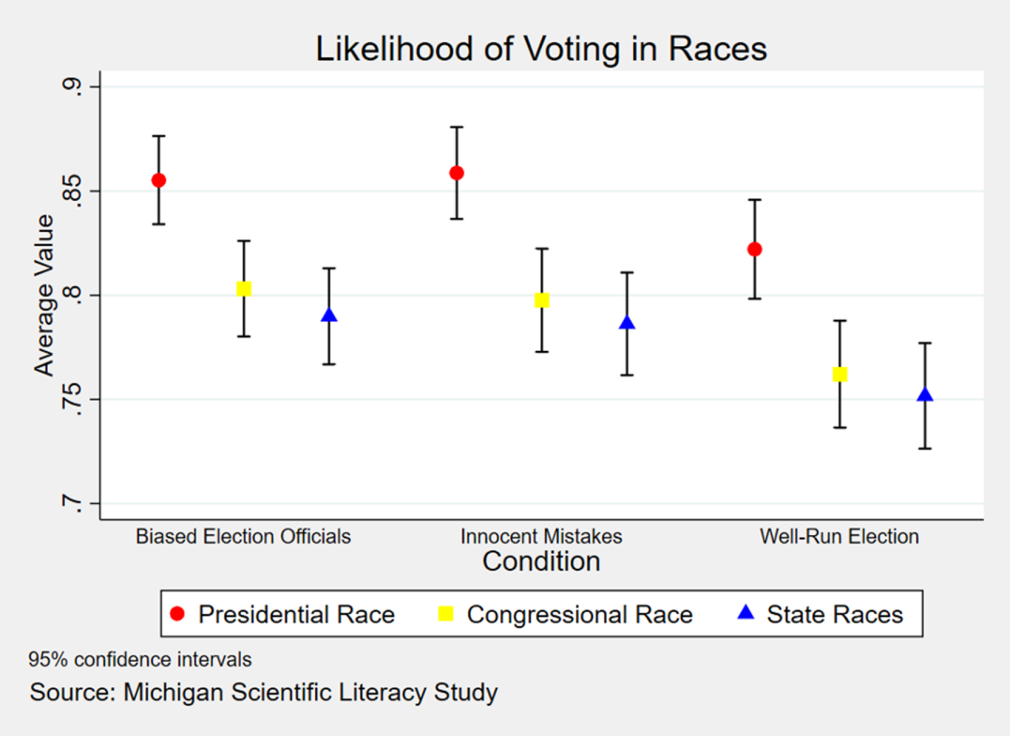
In a survey experiment fielded on an NORC AmeriSpeak panel of around 2000 respondents in November and December of 2019, respondents were presented with news stories that described a local election under three scenarios: first, in which there were long lines and poll workers were unhelpful in some neighborhoods, second, an election in which there were scattered reports of long lines but not limited to certain neighborhoods, or third, a well-run election. After an opportunity to describe their reaction to the news story, respondents were asked how likely they were to vote in the 2020 election, and how likely they were to participate in other ways—by donating to a campaign, volunteering on a campaign, and working as a poll worker. I hypothesized that voters who read about Election Day problems due to malfeasance would become more likely to participate in the future.
My results show that those who read about Election Day problems, regardless of the reason for those problems (in both the first and second conditions described above), reported that they were very slightly more likely to vote than those who read about well-run elections. This is consistent with findings on how anger and psychological reactance can produce a backlash to threats to the right to vote, and motivate people to participate and protect their right to vote (Valentino and Neuner 2017; Biggers 2021). Reading about Election Day problems did not make respondents any more or less willing to participate in politics in ways other than voting, regardless of the reason for those problems. This may be due to people believing that voting is a way to protect their threatened right to vote, but participating in politics in other ways does not.
2016 Cooperative Congressional Election Study
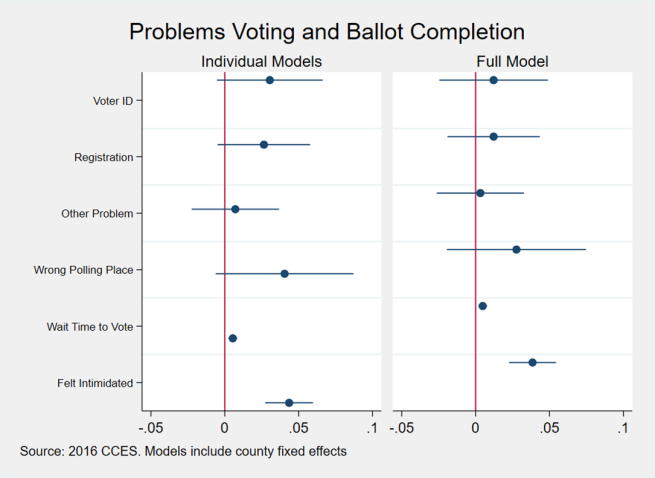
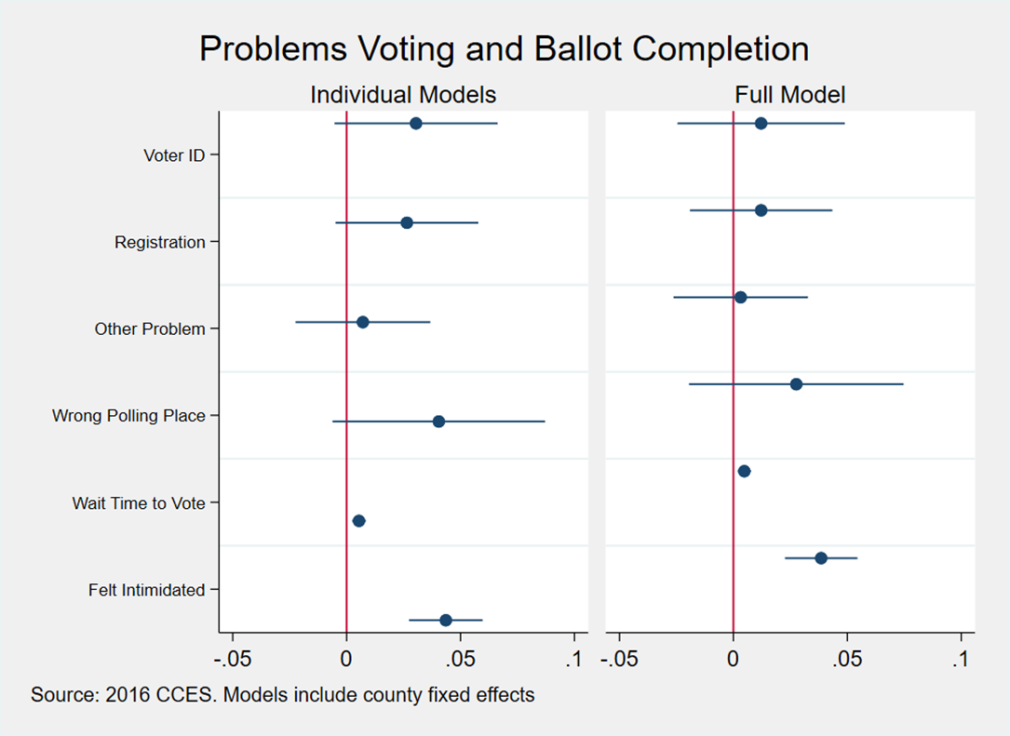
Having shown that people who encounter problems with the voting process may become slightly more likely to vote in the future, possibly in order to protect their right to vote, the natural next question is how voters react in the moment when they encounter a problem. I hypothesized that voters who encounter problems while voting and continue on to successfully cast a ballot will vote in more down-ballot races in order to “get their money’s worth” (see Reilly and Ulbig 2018; Lamb 2021). To test this expectation, I used the 2016 CCES which asked respondents if they encountered a problem while voting (how long they waited to vote, if they felt intimidated while voting, if they had problems with their voter ID or voter registration, and if they went to the wrong polling place) and asked respondents about their down-ballot participation. I operationalized this down-ballot participation with a measure of the share of possible races that the respondent reported voting in, ranging from 0 to 1.
I find that those who waited longer to vote and those who reported feeling intimidated while voting participated in slightly more down-ballot races than those who did not report those problems. These results were present in regressions that tested each problem individually (substantively, without accounting for the possibility that people encountered more than one problem) and a regression model that included measures of all problems people may have encountered—but again, this is conditional on the respondents successfully casting a ballot after encountering the problem. Of the 738 respondents who reported feeling intimidated while voting, 72% reported voting in all possible races, but of the 30,808 respondents who did not report feeling intimidated only 59% reported casting a complete ballot. Importantly, this work cannot speak to how many people were prevented from voting by the problems they encountered.
|
|
Full Model |
Individual Models |
|||||
|
|
Dependent Variable: Down-ballot Participation |
||||||
|
Voter ID Problem |
0.0122 (0.0187) |
0.0305* (0.0183) |
|
|
|
|
|
|
Registration Problem |
0.0122 (0.0159) |
|
0.0265* (0.0160) |
|
|
|
|
|
Other Problem |
0.0032 (0.0151) |
|
|
0.0071 (0.0151) |
|
|
|
|
Wrong Polling Place |
0.0276 (0.0240) |
|
|
|
0.0405* (0.0238) |
|
|
|
Felt Intimidated |
0.0385*** (0.0081) |
|
|
|
|
0.0435*** (0.0082) |
|
|
Wait Time to Vote |
0.0048*** (0.0015) |
|
|
|
|
|
0.0054*** (0.0015) |
|
Age |
-0.0008*** (0.0001) |
-0.0009*** (0.0001) |
-0.0009*** (0.0001) |
-0.0009*** (0.0001) |
-0.0009*** (0.0001) |
-0.0008*** (0.0001) |
-0.0008*** (0.0001) |
|
White |
-0.0283*** (0.0037) |
-0.0289*** (0.0038) |
-0.0289*** (0.0038) |
-0.0289*** (0.0038) |
-0.0289*** (0.0038) |
-0.0288*** (0.0037) |
-0.0282*** (0.0037) |
|
Education |
-0.0046*** (0.0011) |
-0.0045*** (0.0011) |
-0.0045*** (0.0011) |
-0.0045*** (0.0011) |
-0.0045*** (0.0011) |
-0.0046*** (0.0011) |
-0.0046*** (0.0011) |
|
Political Interest |
0.0034* (0.0019) |
0.0036* (0.0019) |
0.0036* (0.0019) |
0.0036* (0.0019) |
0.0036* (0.0019) |
0.0034* (0.0019) |
0.0034* (0.0019) |
|
Strong Party ID |
0.0621*** (0.0029) |
0.0625*** (0.0029) |
0.0625*** (0.0029) |
0.0626*** (0.0029) |
0.0625*** (0.0029) |
0.0623*** (0.0029) |
0.0626*** (0.0029) |
|
Constant |
0.8620*** (0.0101) |
0.8758*** (0.0094) |
0.8757*** (0.0094) |
0.8762*** (0.0094) |
0.8759*** (0.0094) |
0.8735*** (0.0094) |
0.8641*** (0.0101) |
|
|
|
|
|
|
|
|
|
|
Observations |
31,089 |
31,124 |
31,124 |
31,124 |
31,124 |
31,163 |
31,124 |
|
R-squared |
0.0271 |
0.0258 |
0.0258 |
0.0257 |
0.0258 |
0.0266 |
0.0263 |
|
Number of Counties |
2,353 |
2,353 |
2,353 |
2,353 |
2,353 |
2,353 |
2,353 |
|
RHO |
.366 |
.366 |
.367 |
.367 |
.367 |
.367 |
.366 |
Robust standard errors in parentheses
*** p<0.01, ** p<0.05, * p<0.1
Takeaways and Next Steps
In other work in the paper, I show that waiting to vote is also associated with down-ballot participation in 2014, but not in 2012 or 2018. While this research is still in progress, my results suggest that, among those who successfully cast a ballot, encountering problems while voting appears to slightly reduce ballot roll-off. The evidence for whether the reason for the Election Day problem matters, though, is mixed. It did not matter in my survey experiment. However, the fact that feeling intimidated while voting is consistently related to down-ballot participation (and there being no benign reason for feeling intimidated while voting, in contrast to other types of problems voters may encounter) but no other problem outside of waiting to vote has that consistent relationship with participation suggests that they type of problem potential voters encounter does matter.
A necessary next step in this line of research is to explore to what voters attribute different types of problems they encounter while voting—when voters encounter a long line, for example, what percentage of voters think it is due to high turnout as opposed to poor election administration? Other research should also use administrative data on problems at polling places in concert with actual election results to better understand if the patterns in reduced roll-off I find are limited to survey data (and to people recalling their votes and experiences), or there is more down-ballot participation in precincts where there were problems at polling places. Research should also explore if these findings are particularly pronounced among members of communities who face more voter suppression and disenfranchisement, such as Black Americans.
References
Atkeson, Lonna Rae, and Kyle L. Saunders. 2007. "The effect of election administration on voter confidence: A local matter?." PS: Political Science & Politics 40(4): 655-660.
Biggers, Daniel R. 2021. “Can the Backlash Against Voter ID Laws Activate Minority Voters? Experimental Evidence Examining Voter Mobilization Through Psychological Reactance." Political Behavior 43: 1161-1179.
Cottrell, David, Michael C. Herron, and Daniel A. Smith. 2020. “Voting Lines, Equal Treatment, and Early Voting Check-In Times in Florida." State Politics & Policy Quarterly Online First.
Hall, Thad E., and Kathleen Moore. 2014. “Poll Workers and Polling Places." In Election
Administration in the United States: The State of Reform after Bush v. Gore, ed. by
R. Michael Alvarez and Bernard Grofman, 175-185. Cambridge; Cambridge University Press.
King, Bridgett A. 2017. “Policy and Precinct: Citizen Evaluations and Electoral Confidence."
Social Science Quarterly 98 (2): 672-689.
King, Bridgett A. 2020. “Waiting to vote: the effect of administrative irregularities at polling locations and voter confidence." Policy Studies 41 (2-3): 230-248.
Lamb, Matt. 2021. “Who Leaves the Line, Anyway? A Study of Who Leaves Polling Places Lines, and Why." Election Law Journal Ahead of print.
Pettigrew, Stephen. 2021. “The Downstream Consequences of Long Waits: How Lines at the Precinct Depress Future Turnout." Electoral Studies 71.
Reilly, Shauna, and Stacy G. Ulbig. 2018. The Resilient Voter: Stressful Polling Places and
Voting Behavior. Lanham, Maryland: Lexington Books.
Stewart III, Charles. 2017. “2016 Survey on the Performance of American Elections Final
Report." doi:10.7910/DVN/Y38VIQ.
Stewart, III, Charles. 2021. “How We Voted in 2020: A Topical Look at the Survey of the Performance of American Elections.” http://electionlab.mit.edu/sites/default/files/2021-03/HowWeVotedIn2020-March2021.pdf
Valentino, Nicholas A., and Fabian G. Neuner. 2017 "Why the Sky Didn't Fall: Mobilizing Anger in Reaction to Voter ID Laws." Political Psychology 38(2): 331-350.
