How we Voted in 2020
A new look at the data
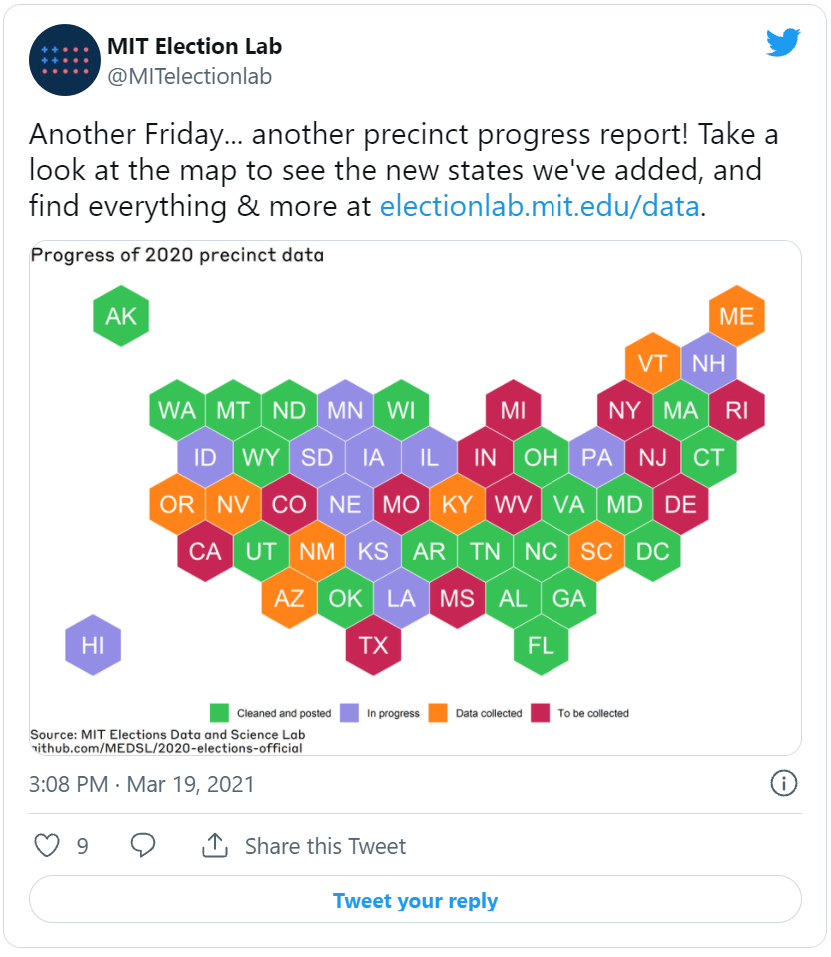
The MIT Election Lab team has been hard at work at a number of data puzzle pieces since the 2020 election — our ongoing precinct data project, for example.
Data news!
The next piece we’re launching is one we’re particularly excited about, so much so that we put out a preliminary report in January, while work on the full project was still underway.
Today, we are proud to launch the data and our full topical report from the 2020 Survey of the Performance of American Elections.
Click here to go right to the portal for our data and the report
What is the SPAE?
The short answer is that the Survey of the Performance of American Elections (SPAE) provides information about how Americans experience to voting in the most recent federal election. It is the only national survey of election administration that focuses on the process of voting, and it provides important insights into election performance in individual states.
The SPAE has been conducted in every presidential election since 2008. In 2020, 18,200 registered voters responded to the survey: two hundred respondents each were interviewed in 40 states plus the District of Columbia. 1000 additional interviews were conducted in the states of Arizona, Florida, Georgia, Iowa, Michigan, Nevada, North Carolina, Ohio, Pennsylvania, and Wisconsin.
What happened in 2020?
You’ll have to read the full report to find out! But here’s a snapshot of the findings discussed:
Voting by mail vs. in person:
- The percentage of voters casting ballots by mail grew to 46 percent, more than doubling the fraction from 2016. On the other hand, the share of voters casting ballots on Election Day fell to 28 percent, from 60 percent in 2016. Sixty percent of Democrats, compared to 32 percent of Republicans, reported voting by mail.
- Voters who cast ballots in person and by mail continued to express high levels of satisfaction with the process, as in past years. Average wait times to vote increased for all modes of in-person voting, and in most states.
- Only about half of the ballots that were mailed to voters were returned by mail. Twenty-two percent of mail ballots were returned to drop boxes. In the long-standing vote-by-mail states of Colorado, Oregon, and Washington, 60 percent were returned to drop boxes.
Voting in a pandemic:
- Worry about COVID was the top reason cited for voting by mail. But 59 percent of in-person voters were “very confident” that the public health measures in their polling place would protect against catching COVID.
- Eighty-seven percent of in-person voters report seeing poll workers wearing masks.
Voter confidence and perceptions of fraud:
- Measured across all voters, confidence that votes were counted as intended remained similar to past years. However, significant partisan gaps opened up.
- Among Republicans, lack of confidence in whether votes were counted as intended at the state level was strongly correlated with whether Donald Trump won the respondent’s state and with the fraction of votes cast by mail in the state.
- Partisan attitudes about the prevalence of several types of vote fraud became more polarized in 2020, particularly attitudes about absentee ballot fraud.
Attitudes toward election reform:
- Voters’ attitudes around reform — both overall support and partisan divisions — remained similar to past years. Partisan divisions most notably opened up further other voting by mail.
- Requiring electronic voting machines to have paper backups, automatically changing registrations when voters move, requiring election officials to be nonpartisan, declaring Election Day a holiday, and requiring voters to show a photo ID to vote were supported by majorities of both Democrats and Republicans.
- Adopting automatic voter registration, election-day registration, and moving elections to weekends are supported by a majority of voters, but not by a majority of Republicans.
Read the full report (and explore the data!) by visiting our portal page here:
Survey of the Performance of American Elections
Along with the report, the 2020 questionnaire and data may also be downloaded, and can be found at the link above. The survey was conducted by YouGov. It was funded in part through the generosity of the Democracy Fund; we are grateful for their support in this endeavor.
As our director, Charles Stewart III, said in a previous blog on this topic, this election was administratively challenging, though well-run; partisan divisions on those challenges and election administration in general are also clear. “This is going to have significant consequences in the months and years ahead as we plan the next steps of election administration in the United States,” Stewart remarked, and that’s surely true. Now that the full report and data are out in the world, we look forward to hearing your analysis and thoughts on what lessons, strengths, and challenges the 2020 experience can provide as we look forward.