Learning About Undervotes from Ballot-Level Data
Evidence from the 2018 Florida Midterm Election
The MIT Election Data and Science Lab helps highlight new research and interesting ideas in election science, and is a proud co-sponsor of the Election Sciences, Reform, & Administration Conference (ESRA).
Michael Morse and Marc Meredith recently presented a paper at the 2019 ESRA conference entitled, “Learning about Undervotes from Ballot-Level Data: Evidence from the 2018 Florida Midterm Election.” Here, they summarize their analysis from that paper.
After election administrators tally the ballots cast in a given election, they typically make aggregated vote totals available to the general public. These summaries have become increasingly accessible and more granular over time.
Acquiring information about how many votes each candidate received in each precinct is now generally quite easy, particularly in a statewide race. But aggregating votes within a particular contest necessarily obscures information about the pattern of votes across contests. Improved voting technology now makes it increasingly easy for election administrators to also distribute the raw ballot-level data produced during the tabulation process. We show that providing researchers access to these data allows us to improve our understanding of voter behavior in a way that informs best practices in election administration.
Our Research
Ballot-level data is still sufficiently novel that it often requires a series of public information requests to acquire. One of us (Michael) spent months engaged in requests for such data from the 2018 Florida general election with all 67 counties in the state. The first figure, below, shows an example of what a ballot-level dataset looks like. Ultimately, most counties were able to produce such data, though many had difficulty initially fulfilling the request because they had never received a similar one. The exact data provided, though, depended on the vendor the county used for vote tabulation. For example, counties that used Dominion as their vendor rather than ES&S could not provide the precinct in which each ballot was cast, while counties that used ES&S could not link the first and second pages of a ballot with the third and fourth pages.
Our study shows how ballot-level data can improve our understanding of undervoting. An undervote occurs when a voter casts no vote in a particular contest. Such votes can be classified into one of two types. An intentional undervote occurs when a voter takes into account the information available on the ballot about a particular contest and chooses to not cast a vote because of indifference, strategic abstention, or to protest the choices available. In contrast, an incidental undervote occurs when a voter fails to take into account the information available about the contest on the ballot or unsuccessfully attempts to cast a valid vote.
Undervotes generally are studied using either survey data or aggregate election returns, but both types of data have notable limitations. Because voters are often unaware when they cast incidental undervotes, surveys are a poor tool to capture the phenomenon. There are also measurement and sampling challenges in generating accurate survey-based measures of intentional undervoting. In contrast, aggregate election returns provide accurate information on the total number of undervotes in each contest — but our ability to differentiate between intentional and incidental undervotes is limited.
Ballot-level data provide equally accurate information about undervotes as aggregate election returns, while also allowing researchers to use the votes cast for other contests on the same ballot to help determine whether a particular undervote is more likely to be intentional or incidental. In this post, we highlight three inquiries into undervoting that are made possible by ballot-level data.
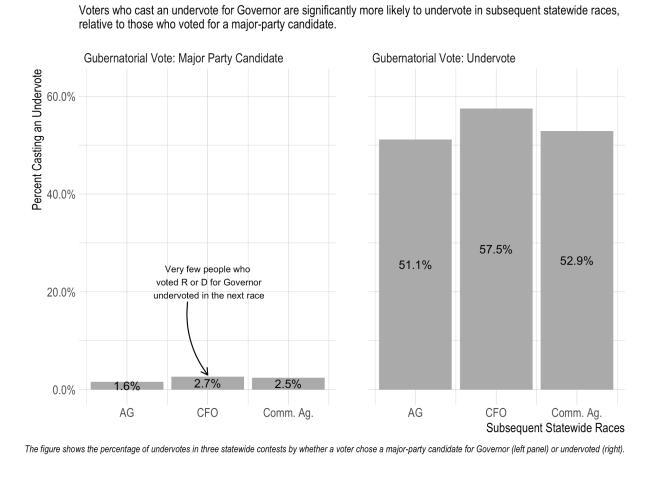
One extant question is whether intentional undervotes reflect dissatisfaction with the idiosyncratic set of candidates in a particular contest or instead reflect a broader dissatisfaction with the two-party system. To address this, we are examining whether the same voters who cast undervotes in Florida’s gubernatorial election subsequently cast more undervotes in the three down-ballot elections for other statewide executive offices. Figure 2 here shows that undervoters in the gubernatorial election were about 25 times more likely to undervote again in a subsequent race than voters who cast a vote for either Republican Ron DeSantis or Democrat Andrew Gillum:
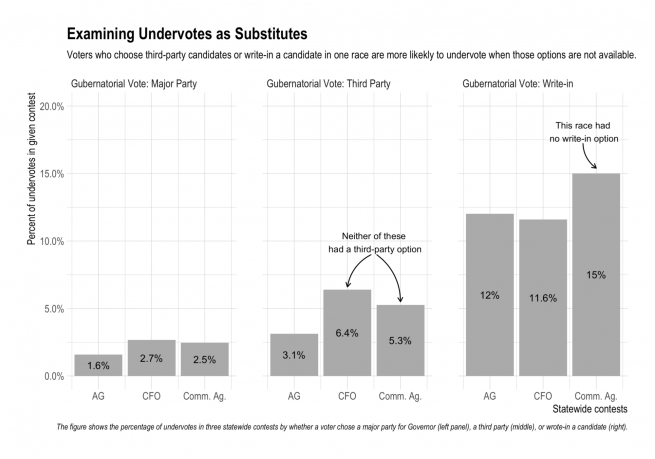
The next figure below further shows that those voters who voted for a third party or write-in candidate for Governor were relatively more likely to undervote in down-ballot races when those options were not available. In the attorney general race, voters had the option to vote for a third-party or write-in candidate; in the C.F.O. race, they could only write-in a candidate; and in the agricultural commissioner race, they could do neither, with the options limited to Democrat or Republican. In future work, we will incorporate more information about the combination of votes on each ballot to estimate the share of undervotes in each race that are intentional.
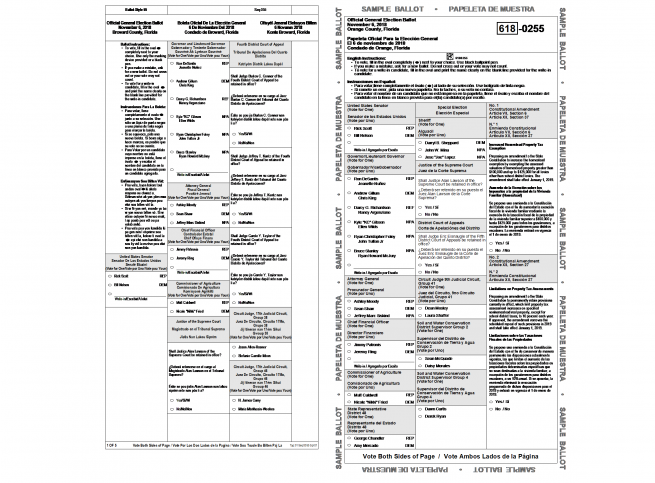
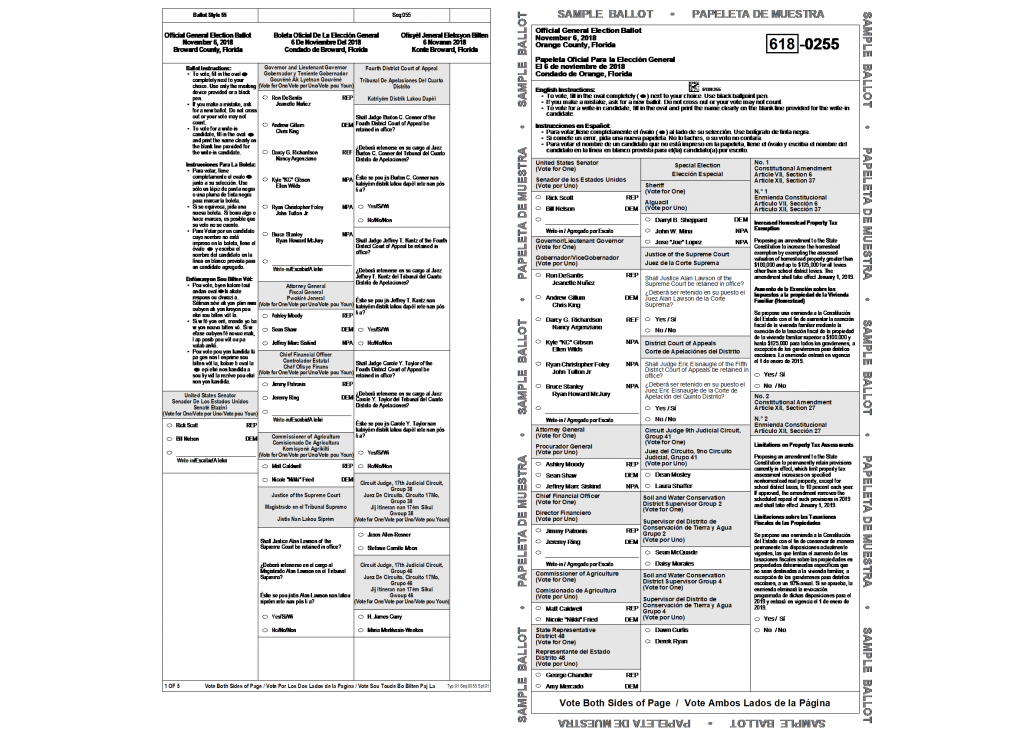
In addition to helping identify intentional undervotes, ballot-level data allows us to quantify the electoral consequences of ballot designs that affect the rate of incidental undervoting, such as the one used in Broward County. The left panel of the figure below highlights that Broward County placed its ballot instructions in the left-most column of its ballot. This contrasts with the ballot from Orange County, presented in the right panel, which, like every other county in Florida, placed its ballot instructions in the header.
In total, 30,413, or about 4.5 percent, of the 682,409 Broward County ballots in our dataset contained an undervote in the Senate race, as compared to, 39,922, or about 0.7 percent, of the 5,406,565 ballots in all other counties for which we have ballot-level data. This elevated rate of undervoting in the Senate race gained national attention because Republican Rick Scott only defeated Democrat Bill Nelson by 10,033 votes, causing some to speculate that Nelson would have won but for Broward County’s ballot design.
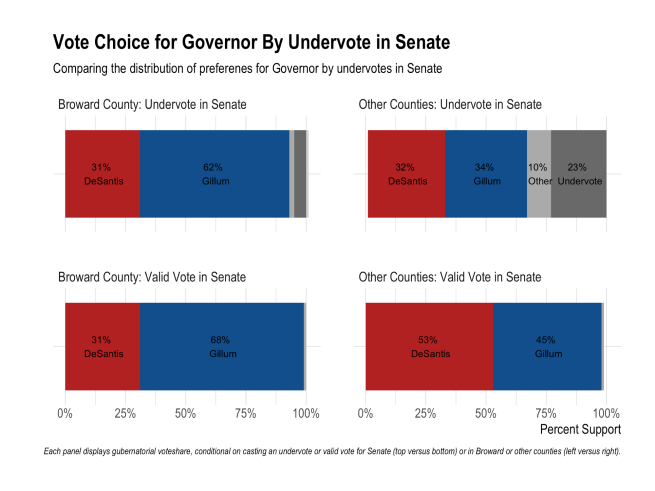
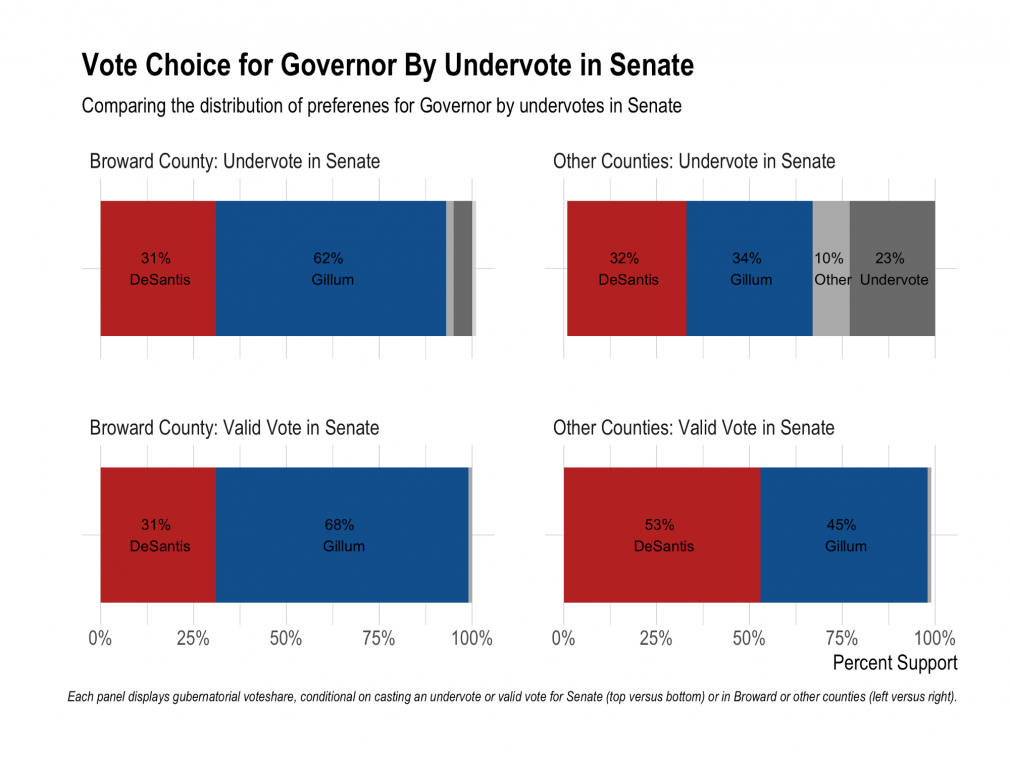
Ballot-level data offer a way to assess this counterfactual. The next graph presents the gubernatorial choice of voters in Broward County and the other counties for which we have ballot-level data. A comparison of the top and bottom rows of the figure bolsters the view that most of the Senate undervotes in Broward were incidental, rather than intentional. Only about 7 percent of Broward voters who undervoted in the Senate race also voted for a third-party or undervoted again in the gubernatorial race. By comparison, about 33 percent of Senate undervoters in other counties also voted for a third-party or undervoted in the gubernatorial race, consistent with a pattern of more intentional undervoting.
f all of the Senate undervoters in Broward County who supported Gillum would have voted for Nelson but for the ballot design, and all those who supposed DeSantis would have voted for Scott, then Nelson would have netted 9,658 votes. Thus, incidental undervoters from Broward could only have been pivotal in the U.S. Senate election if more DeSantis voters split their ticket in Nelson’s favor and/or a disproportionate number who didn’t support either DeSantis or Gillum for governor nonetheless supported Nelson for senator. We are currently working on a more sophisticated analysis that incorporates votes in all of the statewide executive office elections to make a more rigorous assessment of how many votes Nelson lost to Scott because of Broward’s ballot design.
Ballot-level data also can be used to uncover other features of ballot design that cause incidental undervotes, such as page breaks. In Florida’s 2018 midterm election, different voters saw the same constitutional amendment on different ballot pages, with variation not only across counties and precincts, but within precincts too. This was because the twelve statewide amendments on the ballot were listed after all of the candidate races — but some counties and precincts had more than others. In addition to the statewide candidate races, there also were races for U.S. House, state legislature, district and circuit courts, county and municipal governments, school boards and other special districts, and local initiatives and referenda. Ballot-level data’s primary advantage is that it captures the valuable variation in split precincts that precinct-level data would otherwise miss.
We supplemented the ballot-level election data by collecting a copy of each county’s sample ballots, again via a series of public information requests to each of Florida’s 67 counties. The samples allow us to identify the ballot position of each contest — including its page, column, and relative ordering.
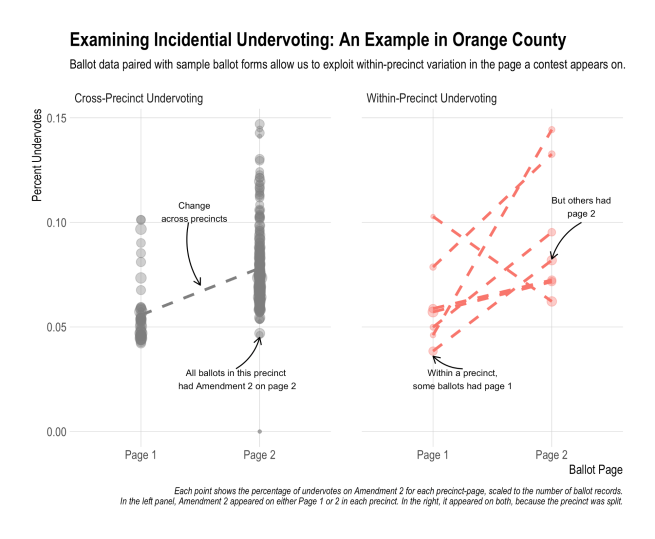
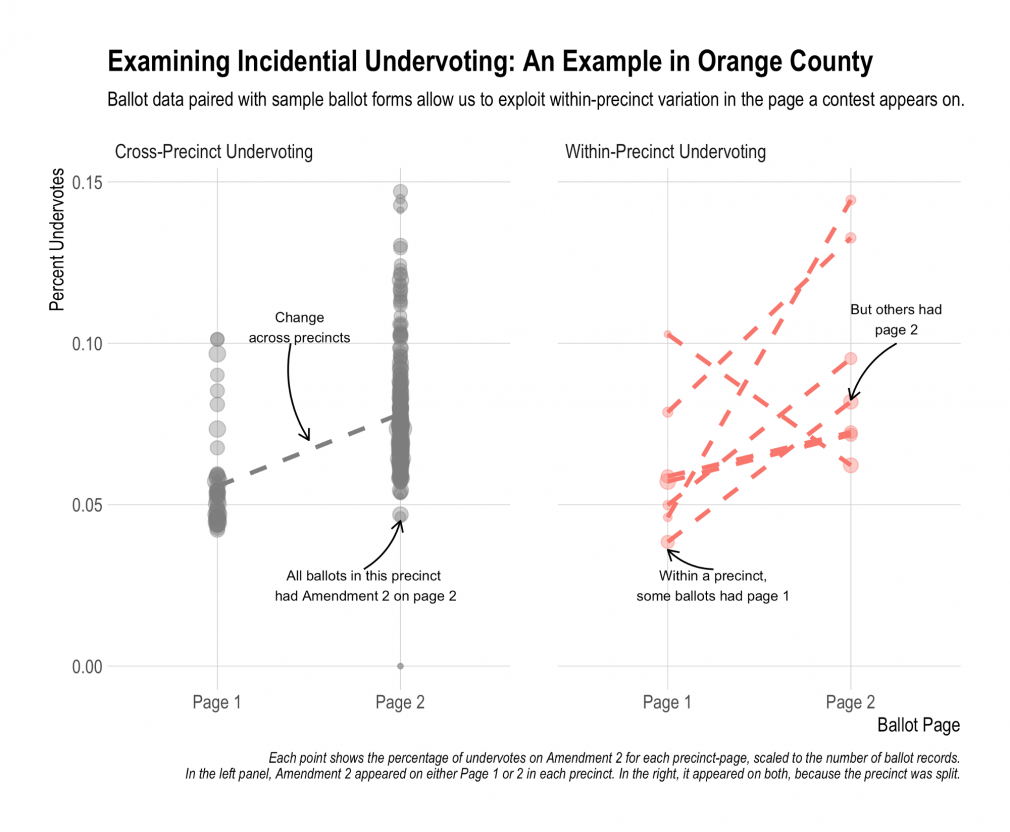
The next graph, below, illustrates how we use the two data sources to estimate the effect of page breaks on undervoting in Orange County. The left panel shows precincts in which every voter observed Amendment 2 on the same page. While there is a lot of heterogeneity across precincts in the rate of undervoting, the rate is higher when Amendment 2 was listed on the second page. Further support for this being a causal effect comes from the right panel, which shows that this same pattern holds when we compare voters within the same precinct, some of whom saw Amendment 2 on different pages. We are currently working on combining data from all counties for which we have both ballot-level election data and ballot-level metadata to generalize this finding about page breaks.
More broadly, though, we hope the election science, research, and administration community will start to produce, use, and work to standardize ballot-level data. Such data is sometimes already subject to public records law and able to be produced without much additional burden on election administrators. The biggest obstacles we see to the broad use of ballot-level data is its limited accessibility, requiring many local public information requests, and the lack of a shared terminology or consistent definition. Ballot-level data alternatively goes by the term ballot records, ballot images, cast vote reports, and audit files, each with varying information that requires considerable clean-up. Both are solvable and, we think, worthwhile.


