Spotlight on Texas: Record Breaking Early Vote Turnout
Highlights
- At the end of the early voting period, Texans have cast 9,718,648 early votes, consisting of 8,745,565 early in-person votes and 973,083 mail-in ballots.
- This represents 108% of the total votes cast in Texas in 2016, and 57% turnout among registered voters.
- Assuming that 80% of people voted early, estimated total turnout in 2020 would be slightly over 12 million votes cast, a 35% increase from 2016.
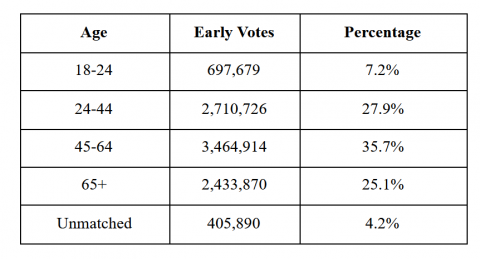
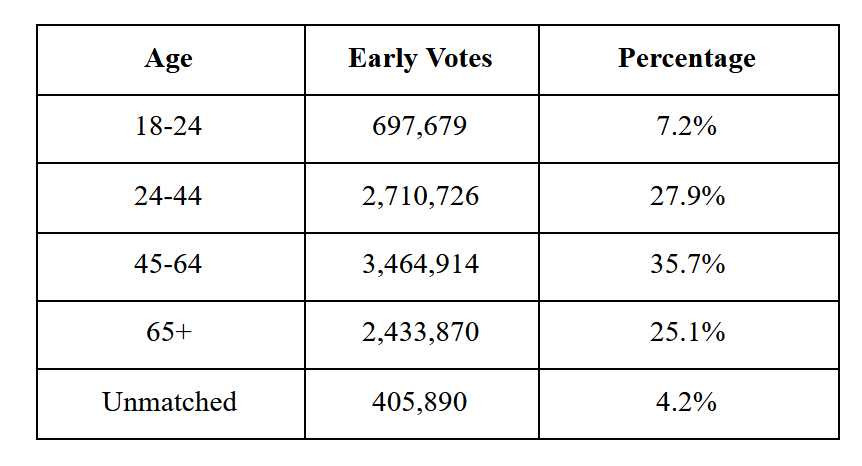
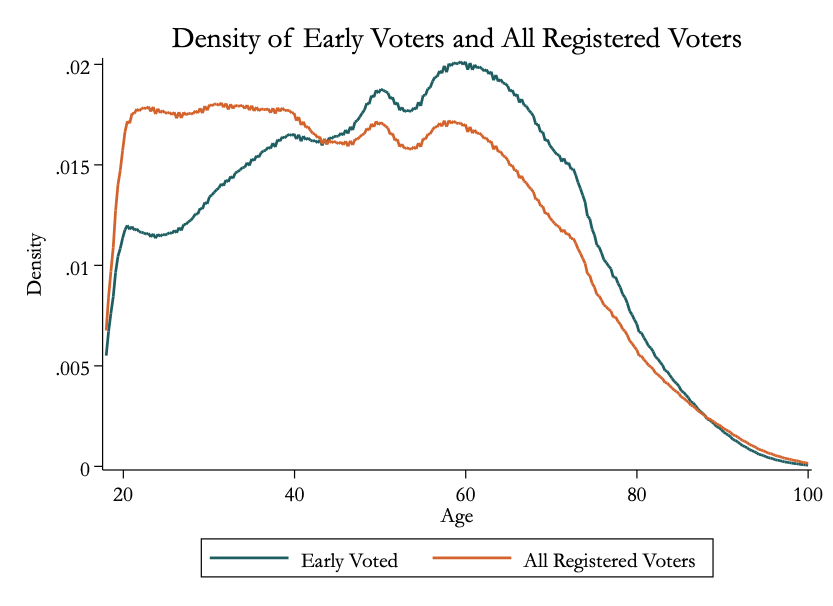
- Voters over the age of 45 make up a disproportionate share of early votes (relative to their share of registered voters). While voters aged 18–24 make up only 7.2% of the early votes, this represents a huge surge in youth early vote turnout.
- Democratic leaning counties, as well as counties that shifted towards Democrats between the 2016 Presidential and 2018 U.S. Senate race, show the highest rates of early voting, both relative to votes cast in 2016 as well as in terms of the share of registered voters.
Historically, Texas has been one of the lowest voter turnout states in the entire country — 3rd to last in 2016, only ahead of West Virginia and Hawaii. But a dramatic shift seems to be happening in the lone star state. The 2018 midterms saw record turnout — 52% of registered voters showed up at the polls, up from only 34% in the 2014 midterms and 38% in 2010. And between 2016 and 2020, over 1.9 million more people registered to vote, an increase of 12% in just four years.
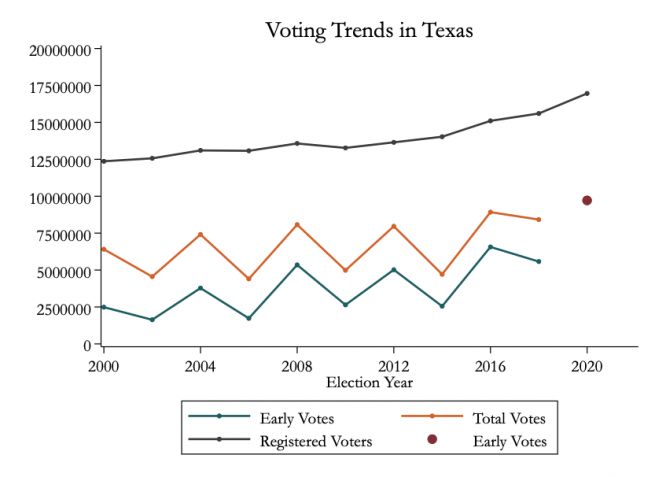
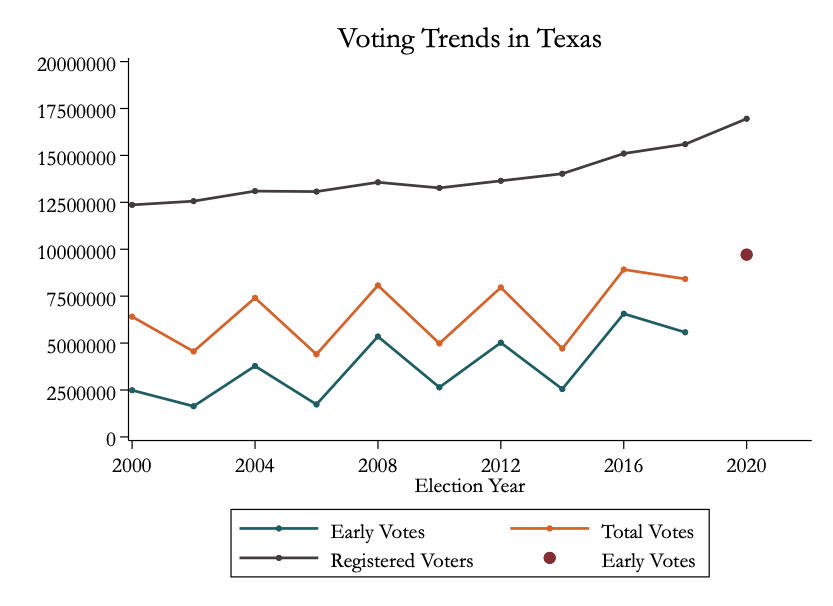
The early voting period in Texas ended this past Friday, and we now know that Texans have cast 9,718,648 early votes, already exceeding the 2016 total turnout by 749,422 votes (108% of the 9 million cast in 2016, before any election day votes have even been cast this year). As a percentage of registered voters, Texas is already at 57%, while in 2016 the total turnout was 59% of registered voters. This election will most likely prove to be record setting for Texas, both in terms of absolute turnout and as a percentage of registered or eligible voters. Figure 1 shows historical voting trends in Texas, along with the total number of early votes cast in 2020.
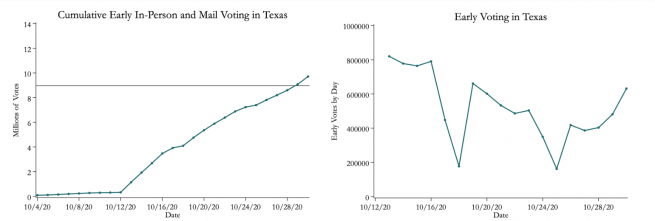
Out of all the early votes cast, 973,083 (10%) of these early votes are absentee-by-mail votes, while the other 8,745,565 (90%) were cast in person during the extended early voting period from October 13th through October 30th. Figure 2 shows the cumulative total (left) and daily totals (right) of early votes cast during the early voting period. Day by day, early voting total remained fairly steady around 800,000 early voters per day during the first week of early voting, started to decrease steadily during the second week (with strong dips on the weekends), and saw a strong spike in the last few days of early voting. According to recent surveys, it seems like around 20% of Texas voters intend to vote on election day. Assuming that 80% of people have already voted early, this leads to an estimated total turnout of over 12 million voters (12.14 million voters, to be more exact).
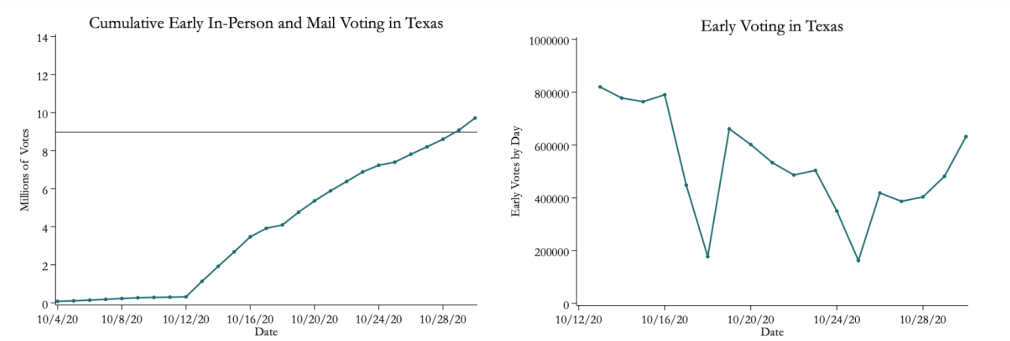
Figure 2: Texas early voting; (left) cumulative early votes by date; (right) early votes cast each day. The horizontal line on the left panel shows the total number of all votes cast in 2016
Early Voting by Age
From the Texas Secretary of State’s website, a list of all early voters for each county can be downloaded for each day of early voting. We collected these early voter lists and merged them to a Texas voter file, which we collected in the middle of summer 2020. The voter file contains the age of all registered voters. But because of when we received the voter file, we are missing the ages of voters who registered between September 3rd and the 5th of October. We requested the voter file in August and received it at the beginning of September. The registration dates in our voter file end onSeptember 2nd. Because we do not have voters who registered between September 3rd and October 5th in the voter file, we are missing their ages and so instead classify them as “unmatched” registrants.
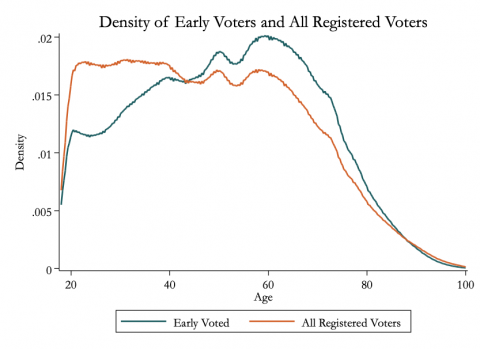
The table below shows the age distribution of early voters, and Figure 3 shows age density plots for both early voters and the set of all registered voters. Young voters make up only about 7.2% of the early vote, while voters over the age of 45 make up more than half of the early votes. Overall, 405,890 early voters (4.2%) could not be matched to the voter file — likely because they registered after September 2.
Early Voting and Partisanship
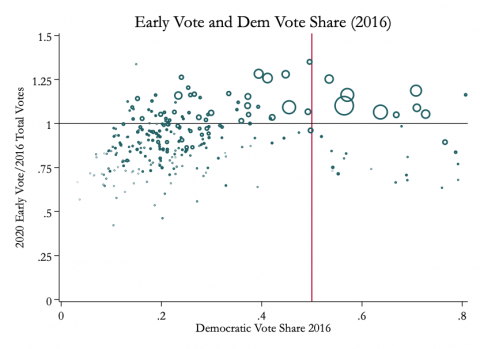
Using two-party vote shares at the county level, we can examine how early turnout in 2020 is related to previous election returns. Figure 4 shows early votes in 2020 as a share of total votes in 2016 on the y-axis, with 2016 presidential two-party democratic vote share on the x-axis. The size of the circle is total registered voters in a county. Generally, larger counties and counties that were more democratic in 2016 have higher 2020 early vote turnout (relative to their 2016 total turnout) than smaller counties or less democratic counties (i.e. rural counties).
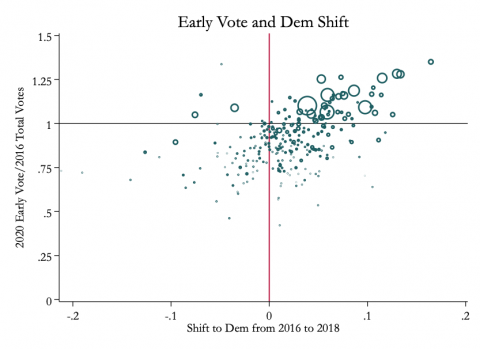
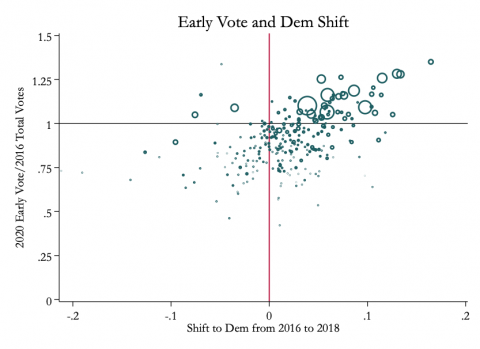
In the 2018 midterms, there was a marked shift towards democrats — Ted Cruz won his statewide U.S. Senate race against Beto O’Rourke by only 2.5%, relative to Donald Trump’s win of 9% only two years earlier. Figure 5 shows 2020 early votes as a percentage of 2016 total votes by how much each county shifted towards democrats between the 2016 presidential election and the 2018 U.S. Senate race (two party vote shares). Figure 5 shows the positive correlation between democratic shifting areas and 2020 early vote turnout. Consistent with other media reports, these figures suggest that the early votes will lean Democratic, while the election day votes will lean more republican.
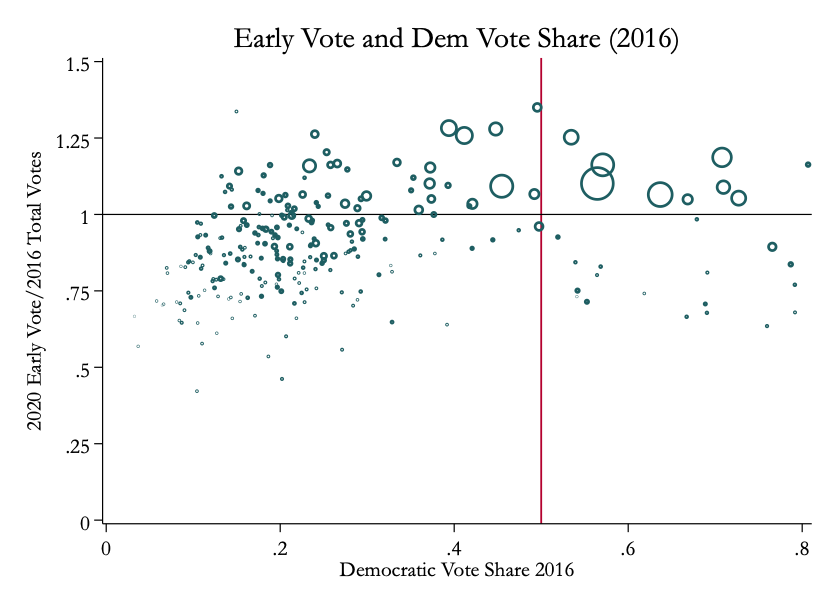
Figure 4: 2020 Early Votes and 2016 Presidential Democratic Vote Share
Figure 5: 2020 Early Votes and Democratic Shift from 2016 (President) to 2018 (U.S. Senate)
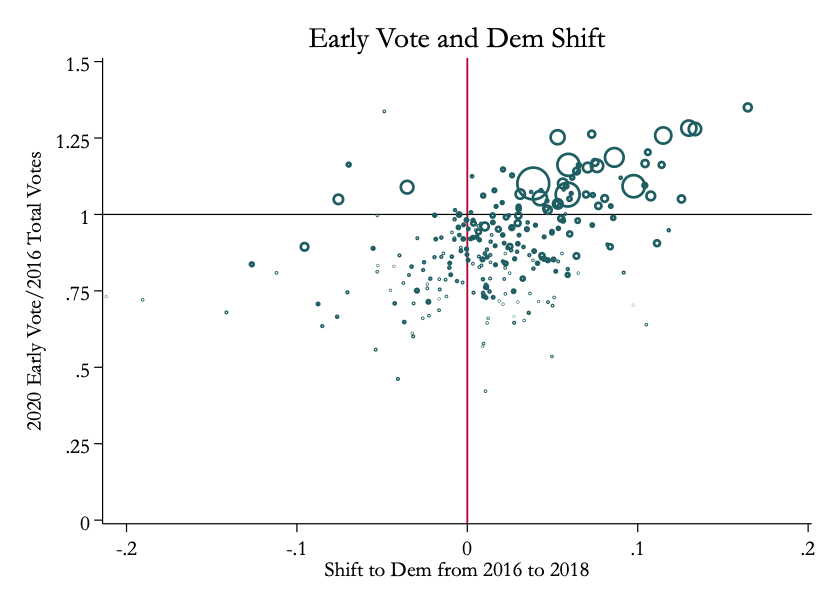
Figure 4: 2020 Early Votes and 2016 Presidential Democratic Vote Share
Figure 5: 2020 Early Votes and Democratic Shift from 2016 (President) to 2018 (U.S. Senate)
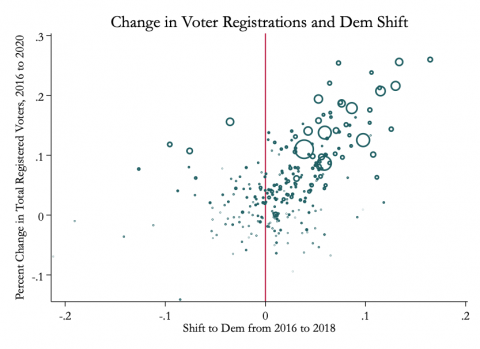
In part, higher turnout in democratic leaning/shifting areas and larger counties is because these counties have experienced the highest growth in population and registered voters over the past four years. Figure 6 shows the percent change in the number of registered voters between 2016 and 2018 by how much the counties shifted towards democrats between 2016 and 2018.
To account for this, we also plot 2020 early vote turnout as a percentage of registered voters (in 2020), instead of relative to 2016 vote totals. Figure 7 plots the 2020 early vote turnout as a percentage of registered voters by Democratic shift. The positive relationship between democratic shift and 2020 early vote turnout remains, demonstrating that the early vote turnout in Democratic shifting counties is higher both in absolute terms and as a percent of registered voters, relative to counties that remained or shifted more Republican.
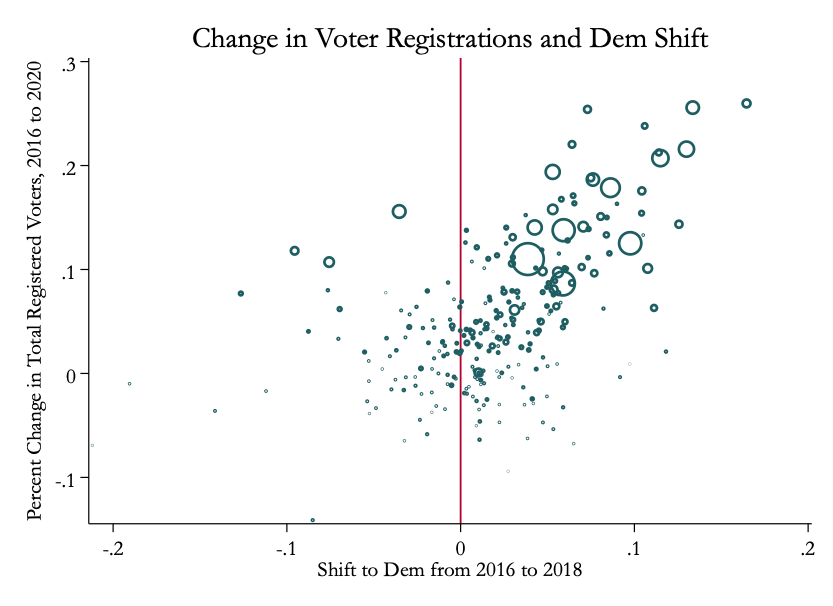
Figure 6: Change in Voter Registration from 2016 to 2020 and Democratic Shift from 2016 to 2018
Figure 7: Early Vote Turnout (% of Registered Voters) and Democratic Shift from 2016 to 2018
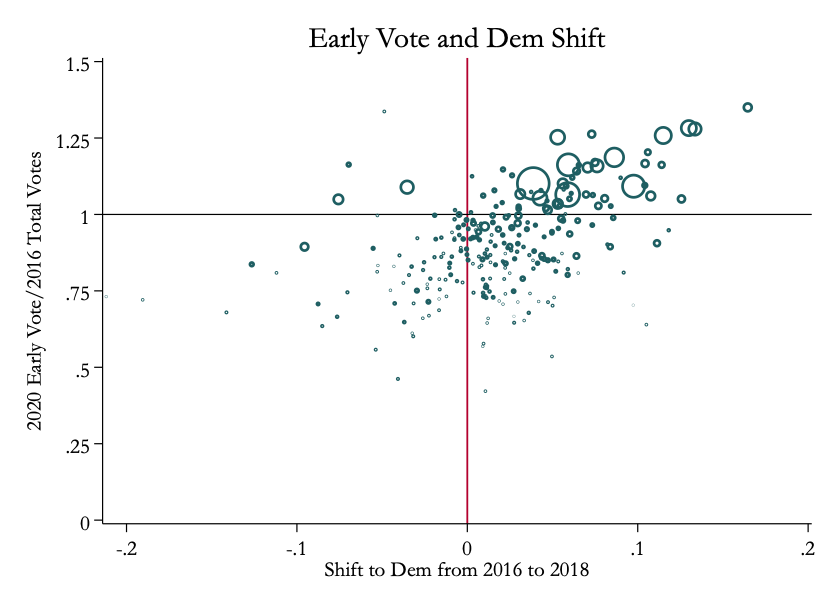
Figure 6: Change in Voter Registration from 2016 to 2020 and Democratic Shift from 2016 to 2018
Figure 7: Early Vote Turnout (% of Registered Voters) and Democratic Shift from 2016 to 2018
Conclusion
Just from the early vote totals, Texas is at 57% turnout as a percentage of registered voters, and it has already exceeded its total votes cast in 2016. Surveys suggest that as many as 12 million people may cast ballots in Texas this election, which would be over 71% total turnout. Older voters (age 45+) make up slightly more than half of the early votes. Texas early votes are more concentrated in larger counties and in democratic leaning counties, both in terms of 2016 democratic vote shares as well as in terms of the shift towards democrats between the 2016 Presidential election and the 2018 U.S. Senate election.
On election day, there are few things to watch for. It seems likely that, because of lower exposure risk to COVID and due to partisanship, rural and more republican counties will have higher election day turnout (as a percentage of registered voters) relative to more urban and democratic counties. Returns from smaller rural counties, and whether they catch up to their 2016 vote totals or 2016 turnout, will be an early sign of whether these counties will be under-weighted relative to the large surge in turnout expected in the suburbs and cities, based on their early vote totals. Looking at the democratic vote shares in large suburban counties — especially in Denton, Collin, Williamson, Hays, and Fort Bend — will give an indication of whether the suburbs have swung away from or towards Trump relative to 2016, similar to patterns we saw in 2018. And in the big cities, high election day turnout should net Biden even more Democratic votes.
