A Summary of the 2020 Election: Survey on the Performance of American Elections
I have been running the Survey on the Performance of American Elections (SPAE), which focuses on the experience of voters as they cast ballots either in person or by mail, since the election of 2008.
In past years, we interviewed at least 10,000 people right after the election. This year, in 2020, we interviewed closer to 18,000 people: 200 respondents from each of 40 states and Washington DC, as well as 1,000 respondents from ten battleground states: Arizona, Florida, Georgia, Iowa, Michigan, Nevada, North Carolina, Ohio, Pennsylvania, and Wisconsin. The survey was conducted by YouGov and funded in part by the Democracy Fund.
This post reviews some of the findings from the 2020 SPAE at a very high level. MEDSL has published a longer summary of the initial findings, which may be downloaded from the lab’s website.
Survey Takeaways
Of all the insights I have taken from the survey, there are a few major takeaways:
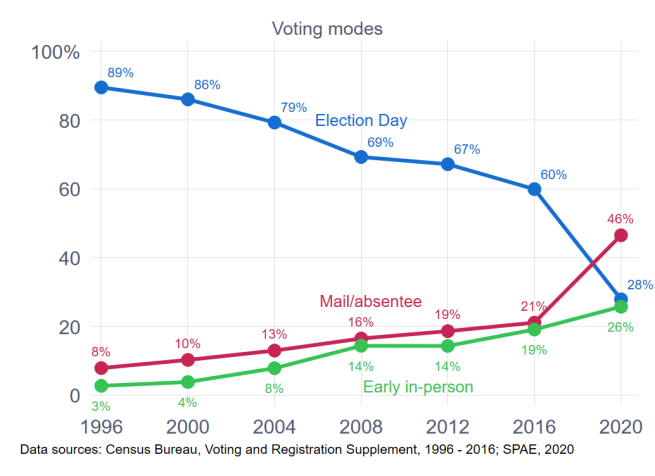
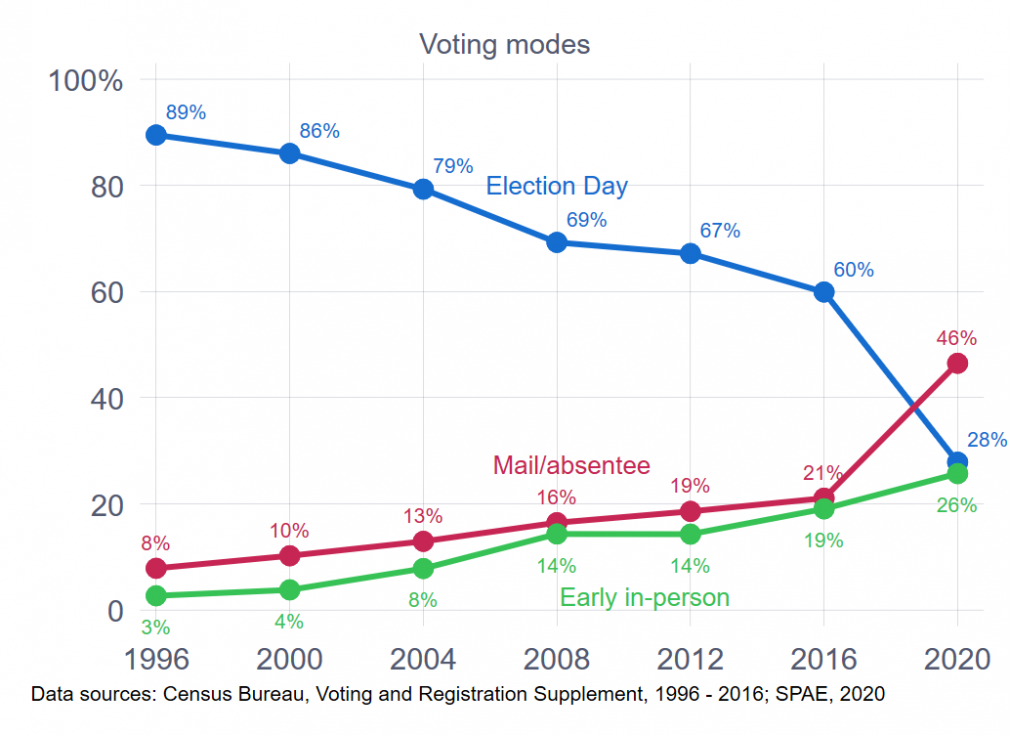
- Half of Americans voted by mail in this election — a quarter on election day and a quarter during the early voting period.
- The experience for voters was positive, consistent with what we’ve known, that this election was run well.
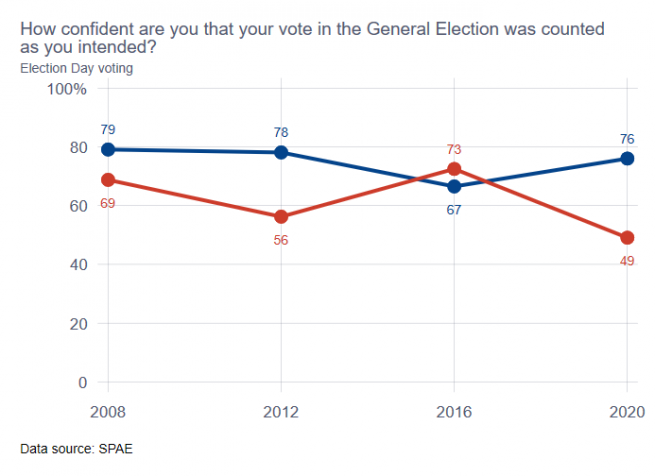
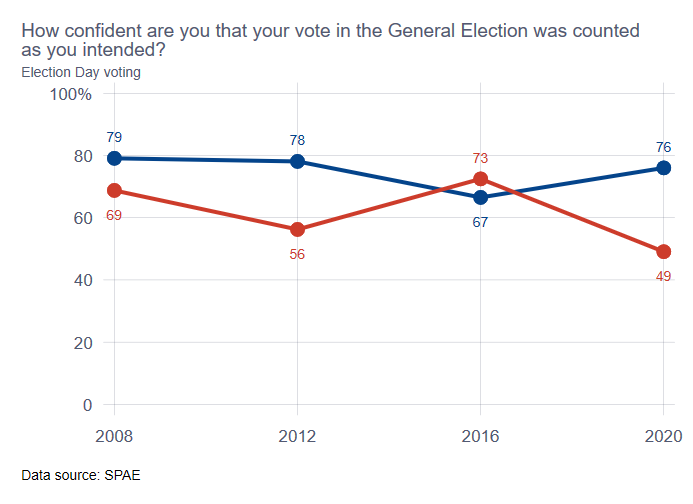
- Confidence in the vote count was similar to past years, but this top-line number masks increased partisan polarization.
- Attitudes about fraud, while they’ve been constant compared to the past, show greater division between the parties.
- Support for voting by mail has increased due to enthusiasm on the part of Democrats. Support has plummeted among Republicans in Vote-by-Mail states.
Voting by Mail
Support for voting by mail has increased, partisan divisions grew.
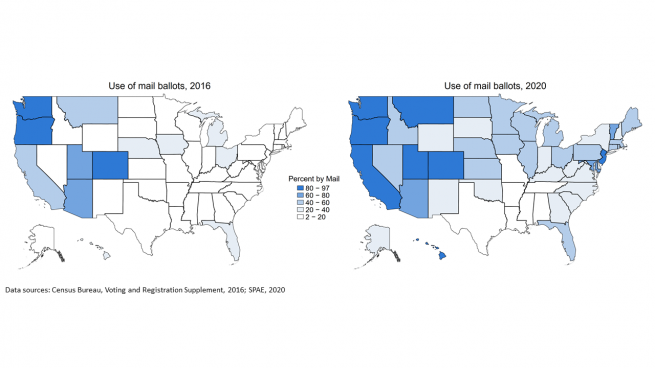
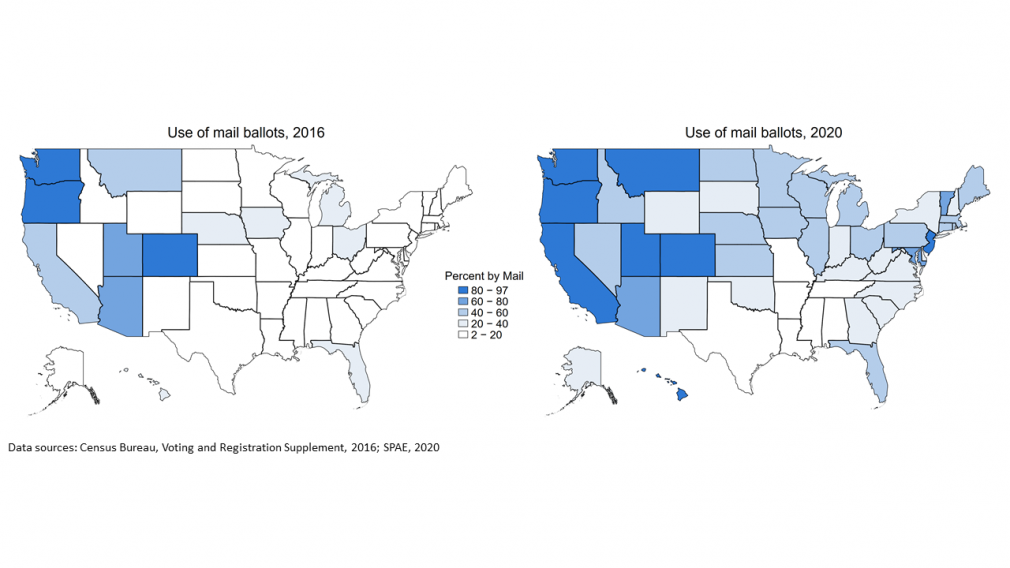
Different states vote in different ways. Most states have increased voting by mail through the years. Voting by mail used to be mainly a west-coast phenomenon. In 2020, while the west still increased voting by mail, the Midwest and the eastern seaboard joined.
Before 2020, there were few measurable differences between Democrats and Republicans in whether they voted by mail. In 2020, the fraction of Democrats who reported they voted by mail (59%) was significantly greater than the fraction of Republicans (30%).
Returning Vote-by-Mail Ballots
Issues of drop boxes became salient during the election. When we asked people how they returned their ballots, in 2016, 2/3 mailed them back; in 2020, only half did. On the other hand, the percentage saying they dropped them off somewhere increased, with drop boxes leading the way. (Sixteen percent of mail voters used drop boxes in 2016, compared to 22% in 2020.)
Sixty percent of people who voted by mail said they were very likely to do so in the future. Democrats (65%) are more likely to say they are very likely to vote by mail than Republicans (49%). These numbers indicate that we might see large amounts of voting by mail in the future, even among Republicans.
In-Person Voting Experience
It was anticipated that maintaining polling places, recruiting poll workers, and bringing in the equipment, including PPE to ensure social distancing and healthy voting, would be challenging.
Voters reported very few problems with registration when they checked in; almost no one encountered problems with equipment. They agreed that their polling place was well-run.
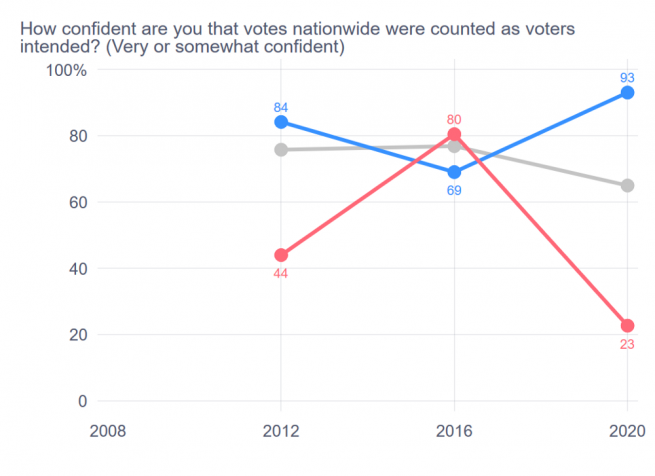
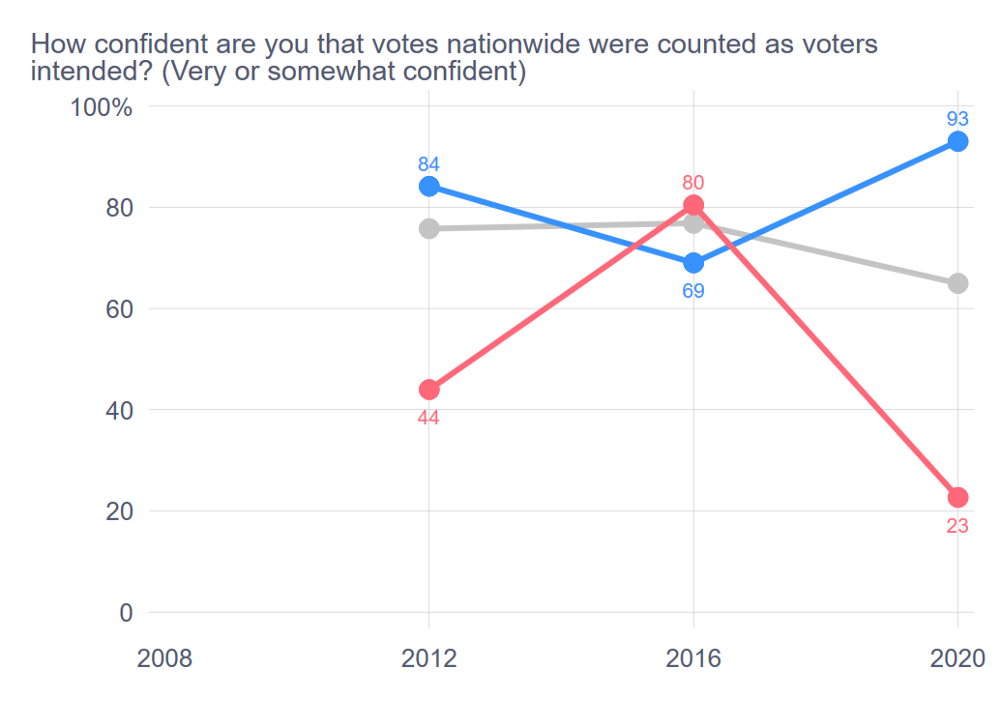
Compared to recent years, voters overall were slightly less confident that their voters were counted as cast. This slight decline masks the difference between Democrats and Republicans, where the gap was the greatest it has been since the SPAE project began in 2008.
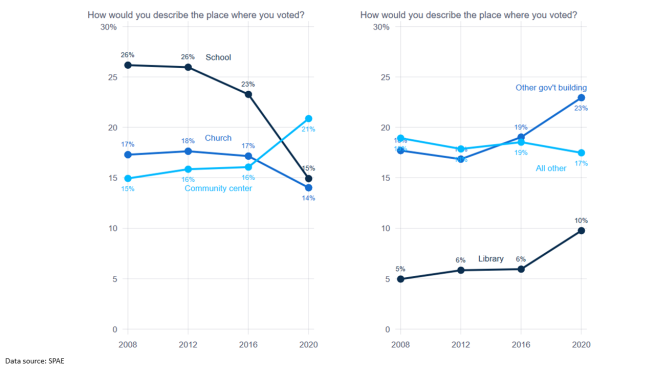
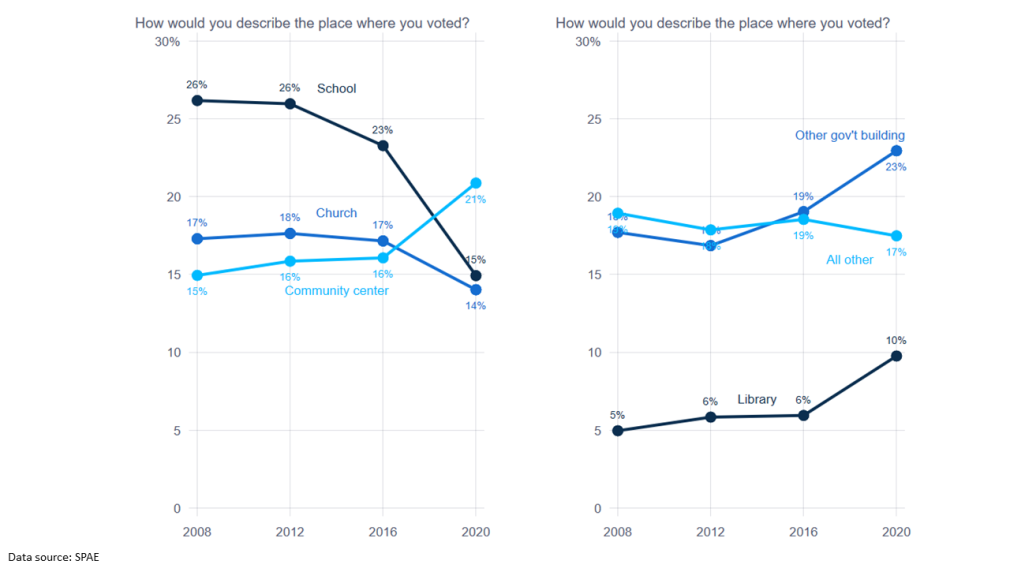
People voted in first-responder facilities, churches, and schools. When we asked where people voted, their tendency to vote in schools and churches dropped significantly from first and second to third and fourth. They were replaced by community centers and government buildings — especially more modern buildings than before. Libraries also offered their facilities. Some even reported voting in an arena or sports facility.
Voters felt that the layout of their polling place protected them from COVID-19. 86 % saw poll workers with masks and 74% saw hand sanitizer. Hand sanitizers and voting booths being clean were associated most strongly with people believing the facility was safe.
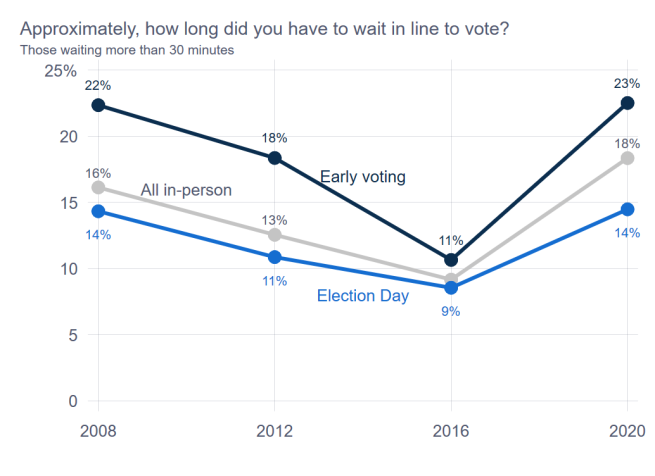
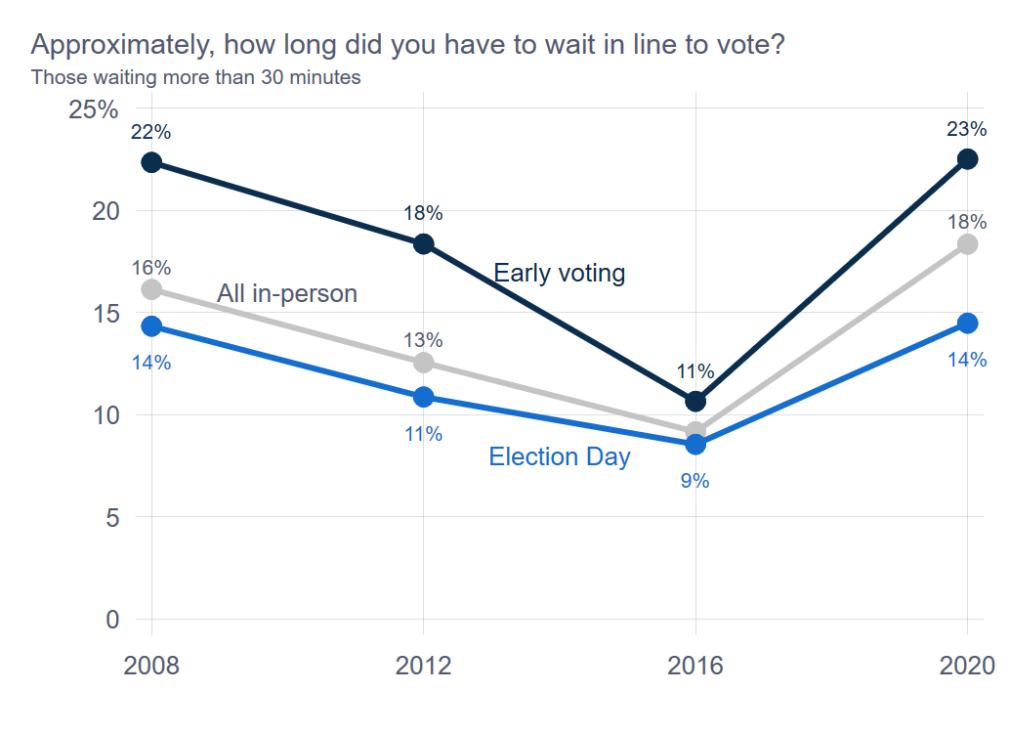
Lines. It’s not surprising that wait times went up significantly from 2016 to 2020. The fraction of people waiting more than 30 minutes roughly doubled.
Confidence in elections
When we asked about confidence, overall, the top lines were similar to the past. The survey asked, for example, “How confident are you that votes nationwide were counted as voters intended?” The number of those who were “very confident” and “not confident” (the two extremes) increased. When we break the data down by party, we see the splitting of the two parties dramatically, and to degrees that we haven’t seen since the 2000 election, when public opinion began to be probed on this issue
Fraud
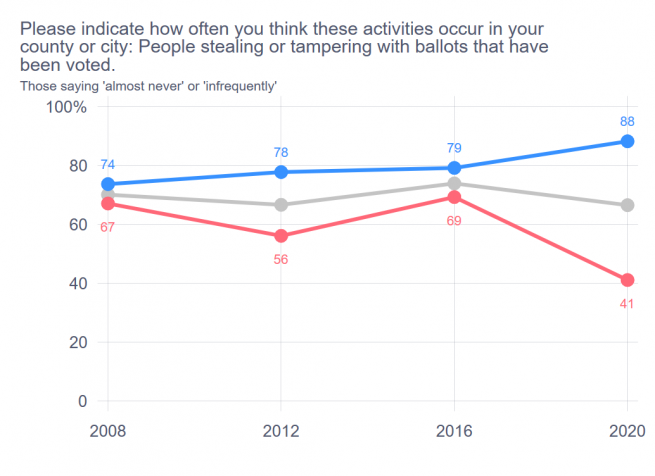
We have been asking for a dozen years about how prevalent people think fraud is. Again, the top lines are very constant with the past. In terms of the fraction of people who believe that absentee ballot fraud is happening, impersonating, illegal immigrants, stealing and tampering with ballots. All of these perceptions have been relatively constant. However, as we break this down by party, Republicans were more likely to believe that fraud is common. There was a big gap in 2020 between the parties and their perceptions.
Reform
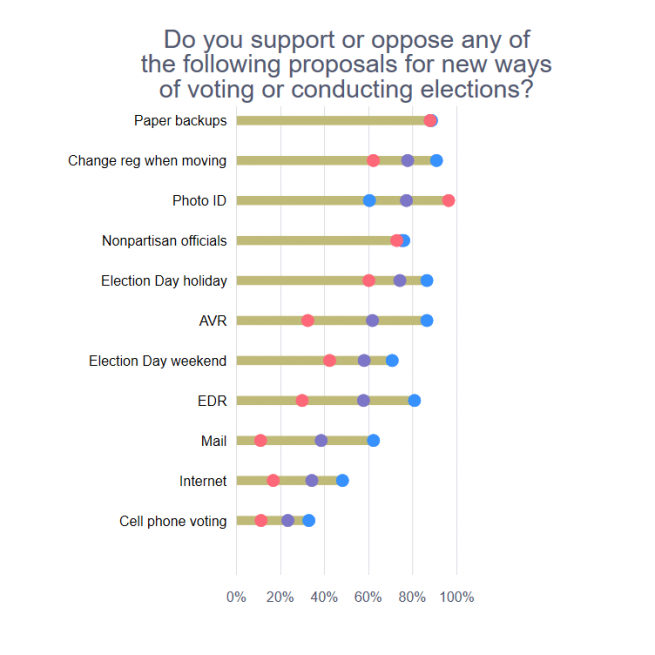
We asked about a number of items relevant to reform, from voting over the internet to selecting election officials on a non-partisan basis. These numbers didn’t change much in 2020. I will note, however, that the items that changed the most were embracing the idea of showing voter ID to vote and running all votes by mail. Support for photo ID went up (both Democrats and Republicans). Support for mail ballots went up overall, primarily because of the large increase among Democrats. Attacks on voting by mail were already playing to fertile ground since Republicans have not perceived vote by mail well in the past.
This has been the most administratively challenging election in history. We’ve seen already many people saying this was the most secure and best-run election in history. Especially when we add degrees of difficulty. According to our surveys, voters had a good experience and saw it as well-run. Partisan divisions are clear at a mass level. This is going to have significant consequences in the months and years ahead as we plan the next steps of election administration in the United States.
