The Underrepresentation of Blacks and Women in State Legislatures
The MIT Election Data and Science Lab helps highlight new research and interesting ideas in election science, and is a proud co-sponsor of the Election Sciences, Reform, & Administration Conference (ESRA).
Our post today was written by Scot Schraufnagel, based on his presentation at the 2021 ESRA Conference. The information and opinions expressed in this column represent his own research, and do not necessarily represent the opinions of the MIT Election Lab or MIT.
A recently developed Cost of Voting Index measures the inclusivity of each state's electoral-institutional climate. Higher values in this index indicate a more restrictive or exclusionary electioneering posture. Motivating the work is a concern that restrictive practices hurt governing legitimacy and can lead to political instability.
The suspicion is that the United States is no different from other countries around the world where compromised democratic institutions or authoritarian rule can lead to protests, violence and economic upheaval. When American states muffle the voice of their citizens through unnecessary election restrictions, there are possible consequences. The lack of voice in itself might not cause disruption. However, when combined with relative economic hardship or other social turmoil, such as a public health crisis, there is a prescription for unrest—disorder of the type the United States witnessed in the summer of 2020 and in January of 2021.
This is the big picture. However, as is often the case, it is only possible to tackle big questions by breaking them down and addressing component parts in an attempt to uncover truth. Most immediately, the concern is whether there are any real world, measurable, consequences to a more restrictive electoral-institutional climate. I begin by testing whether higher Cost of Voting Index (COVI) values have an effect on demographic representation. To conduct the test, I examine two historically underrepresented groups in American politics: Black Americans and women. Most specifically, I seek to answer the question: Does a more restrictive state electoral climate lead to the underrepresentation of Blacks and women in political office? The research uses state legislatures as the testing ground, and seeks to learn whether there is greater underrepresentation of Blacks and women when COVI values are higher.
About the Research
The tests use the level of demographic representation of Blacks and women in state legislatures in 2021. In the figures below, one can find the representation gap on the vertical pr y-axis. State COVI values, in 2020, appear on the horizontal or x-axis. I also run an additional related-test. Assessing questions multiple ways helps to ensure that findings are not the product of a particular test or measurement strategy. In both instances, state COVI values will be the key explanatory variable. In the first instance, the gap in demographic representation is the dependent consideration and in the second instance, the percentage of Blacks or women serving in each state’s legislature is the outcome I seek to explain.
To make clear the representation gap, consider the state of Mississippi. Using the 2019 Census Bureau Population Estimates, one learns that 37.80 percent of state citizens identified as Black or African American. In 2021, Blacks held 31.03 percent of the seats in the state legislature (40 out of 122 in the House and 14 out of 52 in the Senate). Consequently, the Black representation gap in Mississippi in 2021 equals 6.77 percent (37.80 – 31.03). In the second test, the value 31.03 or the actual percentage of Blacks serving in the state legislature is the dependent variable. Can the COVI help us to, systematically, better understand both the gap and the raw percentage?
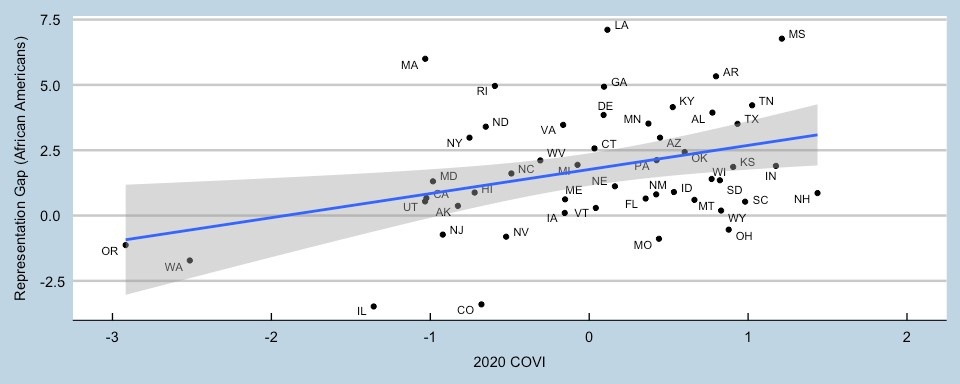
Figures below display the relationship between the representation gap and COVI values. In the first figure, note the strong positive association between the underrepresentation of Black Americans and COVI values. This relationship is easily statistically significant. Note in the Figure, there are actually eight states where Black Americans are overrepresented in the state’s legislature. The eight states all appear below the zero (0) horizontal line. In alphabetical order, they are Colorado, Illinois, Missouri, Nevada, New Jersey, Ohio, Oregon, and Washington. Importantly, six of the eight states have negative COVI values, indicating they make voting less burdensome on average. In the other 42 states, there is an underrepresentation of Blacks in the state legislature in 2021; these states have higher than average COVI values.
The states with more than a five percent Black representation gap are Arkansas, Louisiana, Massachusetts and Mississippi. Of those four, only Massachusetts has a negative COVI value. The other three states are ones where the act of voting is more time consuming or a bigger hassle.

The 2020 COVI and the Gap between %Blacks in State Legislatures and State Black Populations.
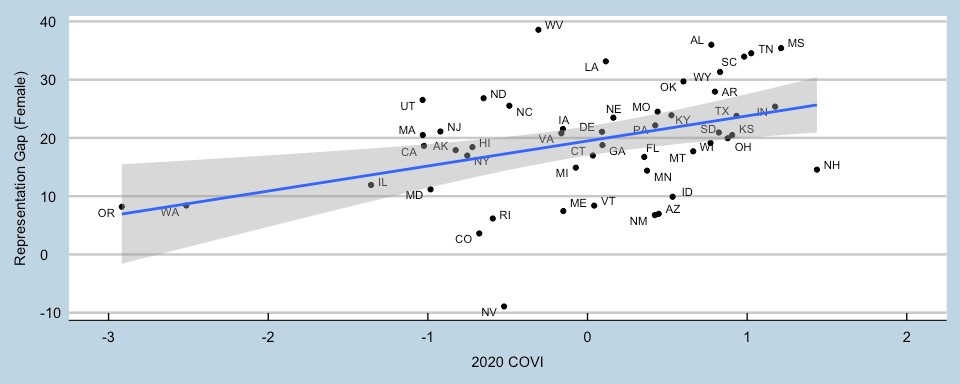
Turning attention to the demographic representation gap of women in state legislatures, in the second figure, I find the same pattern that exists for Black Americans. A statistically significant positive association is obvious. In other words, when COVI values turn positive, voting gets more restrictive, and the gap in female representation grows larger.
Interestingly, there is only one state where women are overrepresented in a state legislature in 2021—Nevada. In the Silver State, 58.73 percent of the 63 state legislators (27 out of 42 in the House and 10 out of 21 in the Senate) self-identified as women. Importantly, Nevada is a state where voting is relatively easy. Note, the representation gap is also smaller (below 10 percent) in Colorado, Maine, Oregon, Rhode Island, and Washington; all states that make it easier to vote, on average. States that make it harder to vote, such as Alabama, Mississippi, Tennessee, South Carolina, and Wyoming, are among the states with the largest female representation gap.

The 2020 COVI and Gap between %Females in State Legislature and State Female Population in 2021.
The scatterplots are interesting and tell an important story. However, to assess the veracity of these results it is possible to test the effect the cost of voting is having on the raw percentage of representatives from the two groups in each legislature, while controlling for other considerations. It is important in this second test to control for the size of the Black and female population in each state and an indicator of “legislative professionalism.” The second consideration serves as a proxy for the elite nature of state legislative processes, which should affect the representation of Blacks and women irrespective of COVI values. To obtain the raw percentage of representation in each state, I combine the number of representatives, from each group in each chamber, and total up the number of seats in each state’s legislature. Dividing the number of representatives from each group by the number of seats, I obtain the proportion of each group. Last, this value is multiple by 100 to obtain %Black Legislators and %Female Legislators and these are the two variables I try to explain.
Specially, the models include the Census Bureau’s 2019 population estimates, of each group, as an important control variable. I expect that as the state Black Population grows as a percentage of all state residents the size of the same group will grow in the state legislature. Although there is some variation in Female Population, I suspect there is not enough variability to pick up a statistically significant relationship in the model used to predict the size of each state’s female delegation. However, the test still controls for this possibility. In 2019, the state with the largest female population is Alabama, 51.7 percent of residents, and the state with the lowest percentage of females is Alaska with 47.9 percent.
As noted, the test also controls for an indicator of legislative professionalism known as the Squire Index. The index assesses the extent to which each states’ legislators are fulltime employees and paid a living wage, among other considerations. Larger Squire Index values suggest greater legislative professionalism. Correspondingly, lower values suggest the state legislature is more of a part time job. In these latter instances, only very wealthy state residents, generally, can afford to take the time to serve in the state legislature. The anticipation is that Black and female representation will associate positively with the 2015 Squire Index values. In other words, the more elite-led amateur legislatures will have fewer minorities and women. Scholars of state politics understand that higher Squire Index values indicate a more traditional or less progressive state governing structure. Therefore, to make sure the COVI is not picking up some of the explanatory power of legislative professionalism I include this variable in the models.
The results are telling. The COVI is easily statistically significant in both the Black and Female models after holding the other two considerations constant. In the first model, that examines Black representation in state legislatures, the coefficient equals -.736. The 2020 COVI ranges from -2.92 to 1.44 or 4.36 units. Considering this, one witnesses a drop in Black representation of more than three percent (4.36 * -.736), when considering the range of COVI values. This is quite an important difference given the average state legislature has only about nine percent (9.43%) Black legislators. The drop for females equals a little more than one percent (4.36 * -.251). As expected the size of each state’s Black population explains a great deal of variation in the presence of Black legislators. In states like Maine and Vermont where Black populations are very low, there are very few Black legislators even though these states make it relatively easy to vote.
The Squire Index of legislative professionalism always returns a positive association, as expected, but it is not statistically significant. When looking at a simple bivariate relationship between the Squire Index and our dependent variables, a higher than average legislative professionalism score associates with more Blacks and women in a state legislature, in 2021, as expected. In the case of females, the bivariate relationship approaches statistical significance.
In this second test, which uses the raw level of representation of each of the two traditionally underrepresented groups, and control variables, I again find real world consequences for a more restrictive state electoral-institutional climate. When states, on average, make voting more difficult, there is a larger representation gap for both Blacks and females, and more simply put, fewer members of each group in state legislatures. One can imagine when COVI values are higher there is a corresponding demobilization of individuals who would be more predisposed to vote for Blacks and women running for a state legislative seat. However, most likely, the results occur because of a reluctance of legitimate high quality Black and female candidates to run for state legislative office when the electoral institutional climate is more restrictive.


