Why do some States make Voting Difficult?
The MIT Election Data and Science Lab helps highlight new research and interesting ideas in election science, and is a proud co-sponsor of the Election Sciences, Reform, & Administration Conference (ESRA).
Our post today was written by Michael Pomante, based on his paper presented at the 2021 ESRA Conference. The information and opinions expressed in this column represent his own research, and do not necessarily represent the opinions of the MIT Election Lab or MIT.
Beginning with the ratification of the Constitution, governments in the United States have implemented policies restricting who can vote. For example, in the early history of the U.S., suffrage was limited to white male landowners. The federal government slowly expanded the franchise over time, eventually extending suffrage to poor white males, Black males, women, and finally those between 18 and 21. Yet, despite these policies, state governments have worked to pass legislation limiting the participation of segments of citizens in elections.
The most notable example is the Jim Crow laws that Southern states passed following the passage of the Reconstruction Amendments. Specifically, the Democratic Party worked to pass legislation that disenfranchised Blacks from voting, although they were based on characteristics other than race. Examples of these restrictive policies include the poll tax and literacy test, which excluded most Blacks and many poor whites.
The passage of the Voting Rights Act of 1965 outlawed these policies. In addition, it required states with a history of discriminatory voting practices to receive preclearance from the federal government before making changes to their election laws. However, the preclearance requirement was struck down in Shelby Co. v. Holder (2013), in a Supreme Court decision that the Act’s formula was outdated and could not be used to determine which states implement discriminatory election policies.
Research on the Difficulty of Voting
In 1957, Anthony Downs theorized in his seminal text, An Economic Theory of Voting, that citizens will abstain from voting when the cost (inconvenience) of voting exceeds the expected benefit. Since this time, scholars have been grappling with how to capture this “cost” accurately. Riker and Ordeshook (1968) eventually modeled this theory, but despite scholars’ interest in the holistic theoretical “cost of voting,” research has generally been limited to studying only one or two types of law at a time. This approach has failed to give us a complete or adequate measure of this cost. In 1994, James King came closest when he created a registration index — but unfortunately, the measure only considered one of the two stages of the voting process, used arbitrary weighting, and was never updated. Therefore, to get an accurate, inclusive estimate of the “cost of voting,” my co-authors (Scot Schraufnagel and Quan Li) and I created the Cost of Voting Index (COVI).
The COVI is a single value that captures how difficult it is to vote in a state, based upon the state’s adoption of any combination of 46 policies that govern elections throughout the 50 states. Values are calculated for each state for each presidential election from 1996 through 2020. State values take on both positive and negative values. All coding was done so larger values indicate a higher “cost,” and lower values indicate a reduced “cost.” In other words, states with larger positive numbers make voting more difficult. In contrast, states with smaller negative values make voting more accessible.
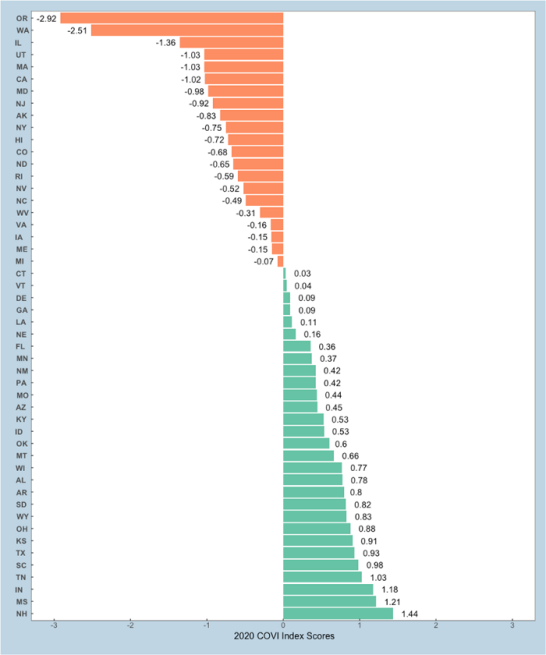
Now that we have a comprehensive measure of the “cost of voting,” we can examine more closely where and why some states adopt policies that make voting more costly (by adding obstacles) or less costly (by removing barriers). The figure below displays the states and their COVI values for the 2020 presidential election. States with negative values, located at the top of the figure, are the easiest to vote in, with voting becoming more costly (difficult) as one moves down the list.
A Modern-Day Jim Crow Environment?
Systematic racism has influenced policy throughout history and still remains in place in the modern era. Therefore, my co-authors and I suspect that the U.S. has not truly moved into the post-racial world described by Chief Justice Roberts in Shelby Co. v. Holder. Specifically, we believe racism still impacts how difficult it is to vote in a state.
The passage of Jim Crow laws provides some insight as to why parties implement restrictive voting policies. Specifically, the Democratic Party passed Jim Crow laws because the number of Blacks within the Southern states was sufficiently large to threaten the political power held by the white ruling class. This starting point leads us to analyze the data through the lens of racial threat theory. In other words, we believe that the difficulty of voting within a state is dependent upon which party controls the state legislative process, and the size of the state’s minority population. Specifically, we know that the Democratic Party implemented Jim Crow laws while in power, and that a political realignment later occurred in the South during the Civil Rights era. Because of this, we believed that the current day Republican Party (GOP) would be associated with more restrictive voting policies. We also hypothesized that a state’s minority population would also associate with a more stringent voting environment. To test these hypotheses, we use the COVI, the percentage of a state’s legislature that is GOP-controlled, and the percent of the state’s Black and Latinx populations.
We get some interesting findings when running bivariate correlations between the COVI and the percent of GOP, Blacks, and Latinx populations. First, we find that the relationship between the COVI and GOP varies significantly by election year. Specifically, we find that the GOP was associated with more accessible voting in 1996 and 2000, but transitions over several elections to associate with more restrictive voting starting in 2016. Second, the COVI and the percent of the Black population strongly correlate with the difficulty of voting in every election. In other words, when a state has a larger black populace, it also tends to have a higher COVI value. Third, we expected a similar finding regarding a state’s Latinx Populations, but did not find it. We find that a state’s Latinx population is only associated with more restrictive voting in 1996. There is no statistically significant connection in any of the other elections. A literature review suggests that it may not be the size of the Latinx population but rather the growth of the Latinx population. Once we take the growth of the Latinx population into account, we find the strong positive correlation we expected. In all instances, when the growth of the Latinx population is more significant, the difficulty of voting is greater. However, we seek to move beyond this elementary analysis.
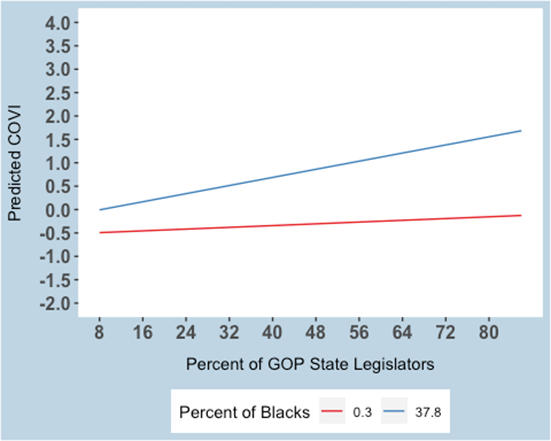
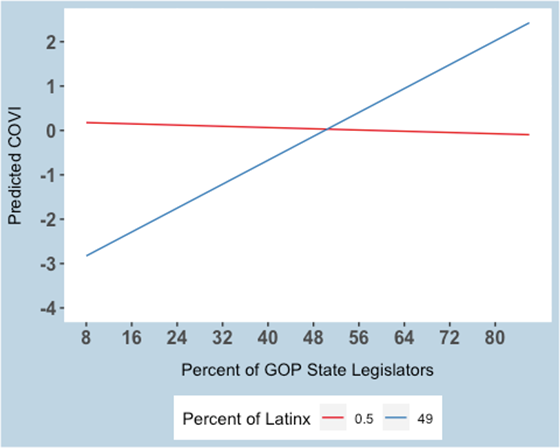
To get a better idea of the effect of the percent of GOP state legislators and the percent of a state’s minority population, we run a random-effects generalized least squares (GLS) model. This model analyzed data from every presidential election from 1996–2020, and considered the difference in the size of Black populations between states while considering the interstate variation in the Latinx population. Figures 2 & 3 below display the results of our model for each minority group. Each figure depicts the predicted cost of voting based upon the state’s GOP population and the minimum and maximum values for each minority population. The blue lines represent the maximum observed value throughout the 50 states. In contrast, the red line represented the minimum value for each population. As a reminder, larger values indicate the adoption of policies that make voting more difficult. On the other hand, smaller values indicate policies that make voting more accessible.
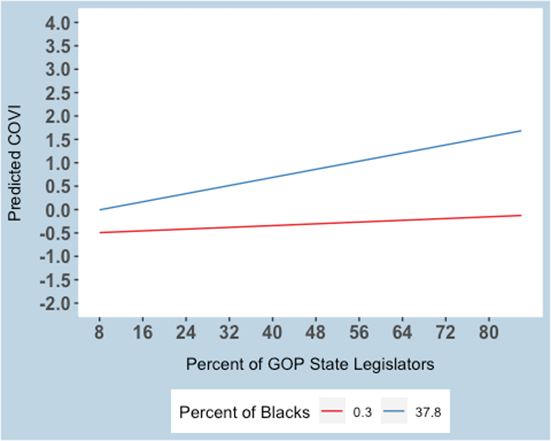
Figure 2. Predicting the Cost of Voting with a state’s Black and GOP population: 1996–2020
Figure 2 shows us that when the size of a state’s Black population is near zero (red line), the size of the GOP in the state legislature does not increase the cost of voting much. However, when the size of the Black population is larger (blue line), the cost of voting rises at a more significant rate when the percentage of the GOP in the state legislature grows.
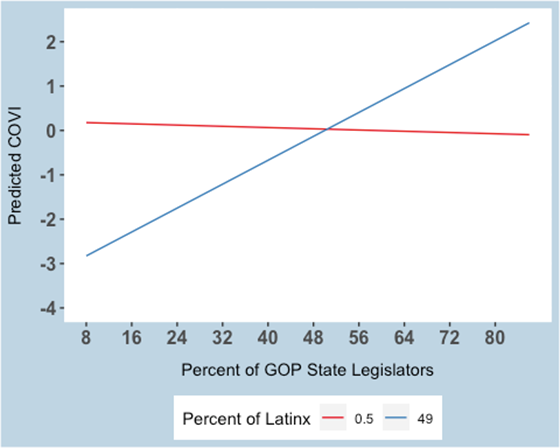
Figure 3. Predicting the Cost of Voting with a state’s Latinx and GOP population: 1996–2020
We expected similar results for Latinx populations. At first glance, we see how the cost of voting decreases when a state has a relatively low Latinx population (red line) and the percentage of the GOP legislators increases. However, this trend changes considerably when the size of the Latinx population becomes more prominent (blue line). The slope of the sizeable Latinx population is surprising. However, it is important to look at the broader context of states which have sizable Latinx populations. For example, California and Texas have similarly large Latinx populations, and are regularly two of the country’s top three most populous Latinx states — but the percentage of GOP members in the legislature of Texas is two times more than in California. This difference contributes to the difference in the cost of voting between the two. Specifically, California makes voting more accessible, while Texas makes voting more inconvenient.
Conclusion
To summarize, Figures 2 and 3 show that, in the past few decades, when the size or growth of a minority population interacts with the percent of a state’s legislature controlled by the GOP, the cost of voting increases. The increase in the cost of voting makes voting more difficult for citizens within the state. These findings indicate that when Black and Latinx populations grow to a size that is perceived to threaten GOP legislators’ political power, they work to make voting more challenging.
Whether or not this demobilizes these minority groups is a separate question. However, these results demonstrate that the U.S. is not yet operating in the “post-racial world” that the USSC majority indicated in Shelby Co. v. Holder. Our findings show that the atmosphere contributing to the Democratic Party implementing Jim Crow during reconstruction is still present in the United States. The only difference is the party enacting the policies. Therefore, we believe it is imperative that Congress pass a new coverage formula for Section 4 of the Voting Rights Act of 1965. Expressly, the U.S. Congress should limit how difficult states may make voting, because it is still evident that when the size of minority groups becomes considerable, legislators can and do work to make voting more difficult for all citizens.
