Measuring Election Confidence in 2020
The MIT Election Data and Science Lab helps highlight new research and interesting ideas in election science, and is a proud co-sponsor of the Election Sciences, Reform, & Administration Conference (ESRA).
Our post today was written by Colin Jones, Robert Stein, Lonna Atkeson, Trey Hood, and Mason Reece, based on their paper presented at the 2021 ESRA Conference. The information and opinions expressed in this column represent their own research, and do not necessarily represent the opinions of the MIT Election Lab or MIT.
The authors will also be presenting this research at the 2022 Southern Political Science Association conference; interested readers can learn more about it in their presentation there.
Central to the operation of democratic governance is the electorate’s confidence that the outcomes of elections are legitimate. Losing candidates and their supporters must believe in the integrity of a lost election for democracies to be sustainable.
There is increasing evidence that voters’ confidence in the outcome of elections, and more specifically, that their vote was counted accurately, is dominated by the whether the voter supported the winning or losing candidate in an election. We ask whether this winner (loser) effect is consistent over time and parties? Additionally, we test whether the strength of this effect on voter confidence varies across electoral level (i.e., confidence in a county, state, and nations vote counting). We identify the voter’s experience casting their ballot and the electoral competitiveness of their state as potential correctives for the diminished confidence among supporters of the losing candidate(s).
Previous Research
Scholars measure voters’ confidence with their response to post-election surveys that asked: “how confident are you that you vote was counted accurately?” Follow up survey questions included: “Thinking about your county, [state] [and the nation], how confident are you that ballots were counted as the voters intended?” Together, responses to these questions provided a picture of voter confidence across a range of contexts.
Research on voter confidence has its current origins with 2000 Presidential election and the difficulties voters had casting a ballot with different technologies (i.e., computer punch cards and direct-recording electronic voting machines) and voting procedures. New voting technologies, long lines, confusing ballots and the quality of assistance provided by polling place personnel shaped the voter’s confidence casting their ballot. Additionally, a voter’s experience at a polling place has been found to significantly shape their confidence. If a voter reports a more positive experience, rates poll workers favorably, and has few problems while voting, they are more likely to believe that their vote was counted accurately.
Beginning with the 2008 election, the focus of voter confidence shifted from concerns with voting equipment and ways voters cast their ballot (e.g., paper trail requirements) to voter fraud and illegal voting, especially among supporters of losing candidates. Voters who cast a ballot for the winning candidate were more confident that their vote was accurately counted, while the losers reported little confidence in the outcome of the election. The shift to concerns about voter fraud and illegal voting presents a new challenge for sustaining voter confidence in elections. Removing electronic voting and adding paper trail ballot requirements may not be sufficient to assuage the low confidence of supporters of losing candidates.
No Harm, No Foul
Due to the rise of the winner (loser) effect, we seek to understand how this effect may be conditional on other factors. A logical place to start is to consider the electoral context of a voter. Research has shown that in sporting contests those losing a game by a large margin are less likely to attribute their loss to ‘bad’ officiating than those who lost a close contest or a contest they expected to be close. We believe this translates well to elections.
For example, consider a Trump voter living in Montana in 2020. The winner (loser) hypothesis would propose that this voter would report decreased levels of confidence due to the fact that they voted for the losing candidate. However, Trump won Montana by a convincing 16.4% in 2020. The Trump voter in Wyoming should be more confident in the election’s outcome (especially in their county and state) than Trump supporters in Georgia, where Trump lost the statewide vote by only .23%. Our expectation is that the diminished confidence in the outcome of an election in which a voter’s preferred candidate lost is moderated by the margin with which the voter’s preferred candidate won (lost) the election within their jurisdiction. We call this the ‘No Harm, No Foul’ hypothesis.
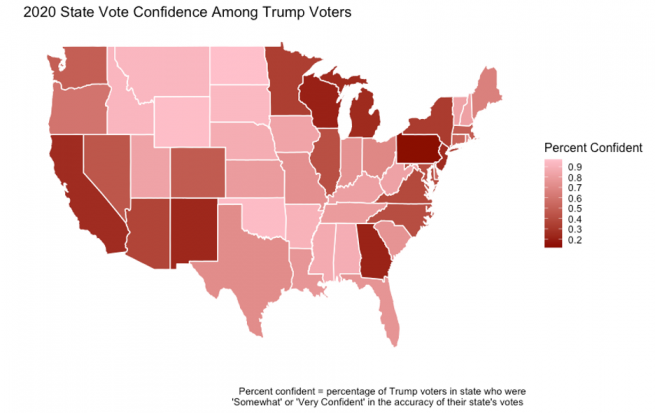
The map below reports the share of Trump voters by state who reported ‘Somewhat’ or ‘Very Confident’ in the accuracy of their state’s vote. Trump voters were much more confident in non-competitive states (e.g., Montana, Idaho, Wyoming, Vermont, New Hampshire), where the margin of victory for either Trump or Biden was greater than 10%. In states where the margin of Presidential vote was less than 10% (i.e., Arizona, Georgia, Pennsylvania and Wisconsin) Trump supporters’ confidence in the election’s outcome did not exceed 20%.
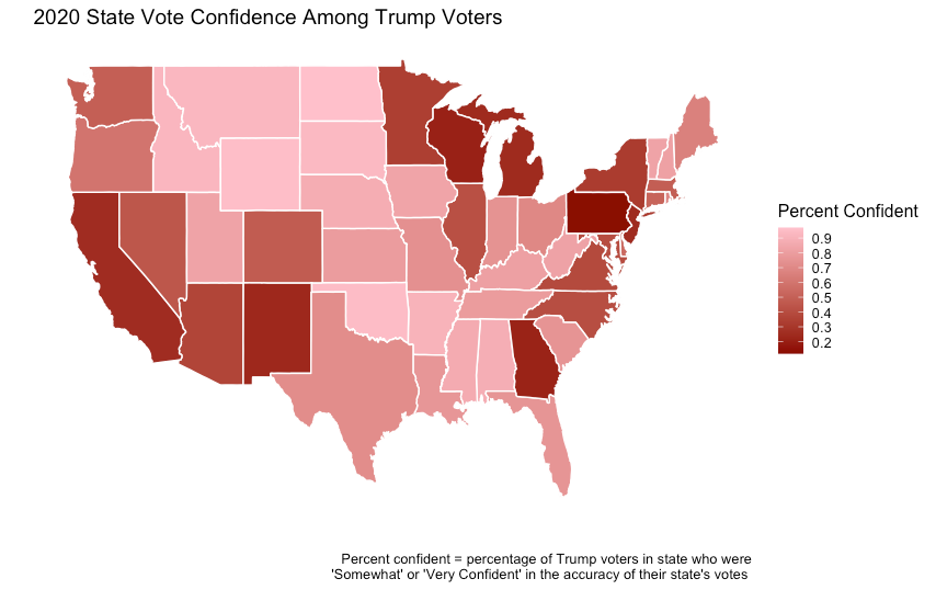
Percent confident = Percentage of Trump voters who were 'Somewhat' or 'Very Confident' in the accuracy of their state's votes.
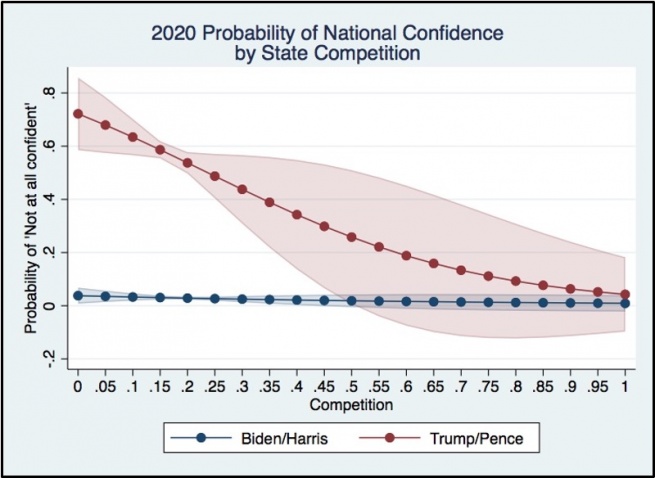
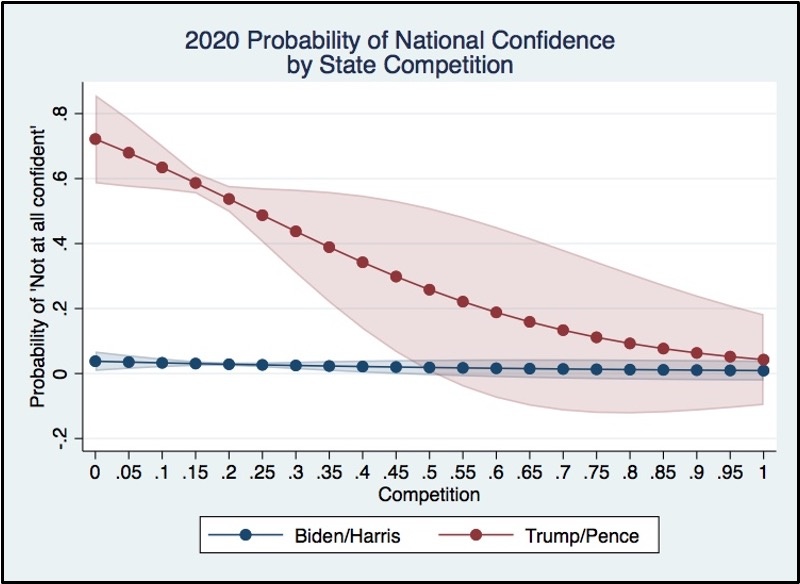
Below is the predicted probability of a voter being ‘Not at all confident’ in the national vote count by state competition and presidential vote choice in 2020. The competition variable is the difference in two party voteshare meaning that 0 indicates the highest level of competition and 1 indicates no competition. These probabilities were computed after running an ordered logistic regression with state fixed effects using data from The Integrity of Mail Voting in the 2020 Election dataset.
Trump voters who live in the most competitive states are more likely to claim that they are ‘Not at all confident’ in the accuracy of the national vote count. However, as competition decreases, the voter confidence increases.
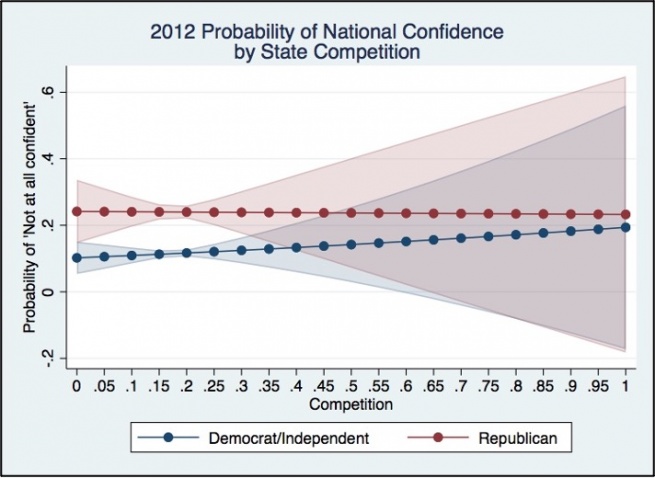
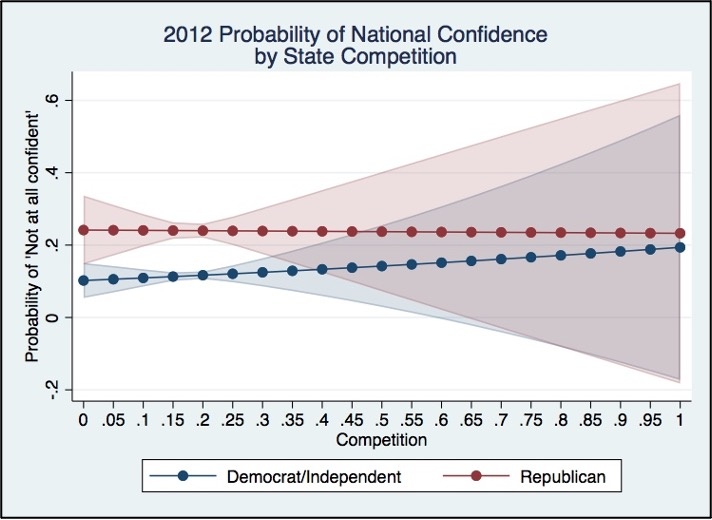
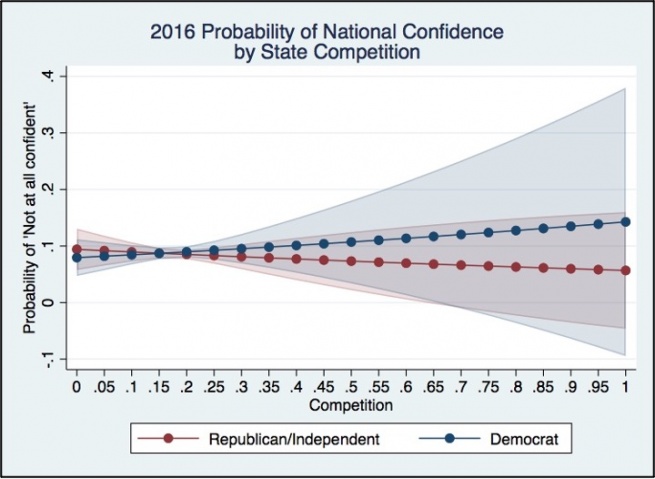
Figures 2 and 3 report the relationship between voter confidence and state electoral competition for voters who supported the party of the losing Presidential candidate in 2012 (Romney) and 2016 (Clinton). These probabilities are computed using data from the Survey of the Performance of American Elections (SPAE) in 2012 and 2016. The SPAE did not ask respondents which presidential candidates they supported. We substitute partisan identification to identify supporters of the winning and losing candidate in the two Presidential Elections.
Though less well defined, we observe non-confidence in the outcome of the 2012 election among supporters of Republican Presidential candidate Romney abates in non-competitive states. This relationship among Republicans closely mirrors voter confidence among Democrats in the least competitive states.
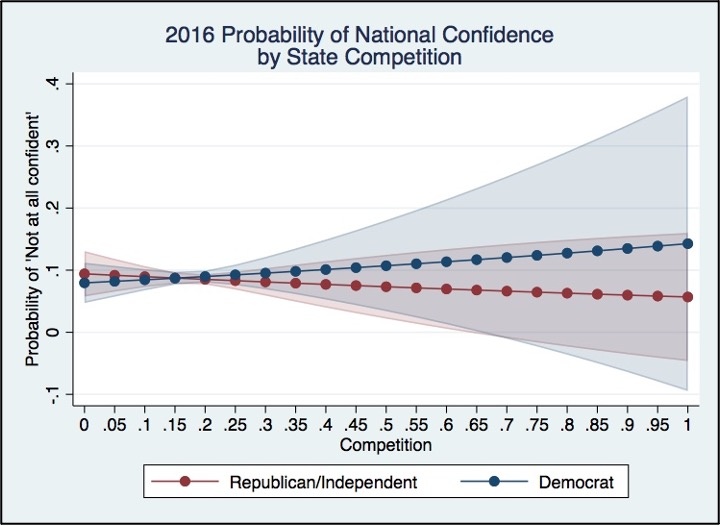
Contrary to our expectation, supporters of Clinton were not significantly less confident in the outcome of the 2016 election. Moreover, there is not sufficient evidence to show confidence among supporters of the losing candidate (Clinton) is strengthened in non-competitive states. These findings may suggest that Democrats react to losing differently than Republicans and don’t decrease their confidence after losing an election, at least significantly enough to be captured by this data. Alternatively, the anomalous finding may due in part to the fact that Clinton won the popular vote but lost the electoral vote, creating some ambiguity about who won and lost the 2016 Presidential election.
The tentative evidence points to several conclusions. In two of the three most recent U.S. Presidential elections, voter confidence in the outcome of these elections was closely tied to support for the losing (winning) candidate. There is further evidence that voter confidence among supporters of the losing (winning) candidate is mitigated by the competitiveness of the electoral context.
In light of the small number of truly competitive states, the latter finding offers some reason to believe the corrosive effect of partisanship on the electorates’ faith in elections is neither widespread nor immutable. Competitive electoral settings is not a condition that is readily or easily subject to change over the short term. Moving forward, scholars wishing to understand how to reverse or at least abate the decline in voter confidence should focus on potentially malleable covariates of voter confidence. Two potential candidates for moderating the negative effect of losing an election has on voter confidence are the level of government voters assignment responsibility for election integrity, and voters’ experience casting their ballots.
Confidence Across Electoral Level
U.S. Elections are conducted at the local level, and it is mostly at the county level where voters cast their ballots. Is there any variation in voter confidence in county, state or national election outcomes? Is confidence in whether votes are counted accurately more consequential at county, state or national level? Does the moderating effect of electoral competition on voter confidence vary across level of government?
Affirmative answers to any of these questions raises the possibility that addressing the consequences of declining voter confidence may rest disproportionately with different units and levels of government. Here we might consider a second potential covariate of voter confidence. Are the voting experiences of individual voters consequential to their confidence that their ballots are counted as they intended? Is waiting in a long line, difficulty with poll workers, and problems verifying voter registration related to a voter’s lack of confidence? If yes, can these experiences be sufficiently improved/enhanced to repair voter confidence?
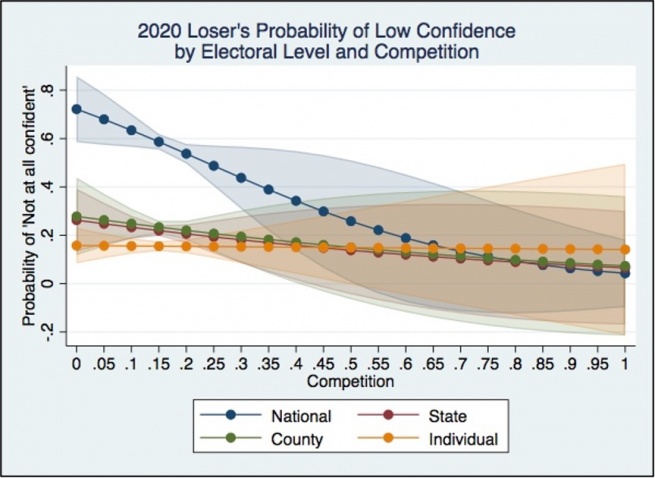
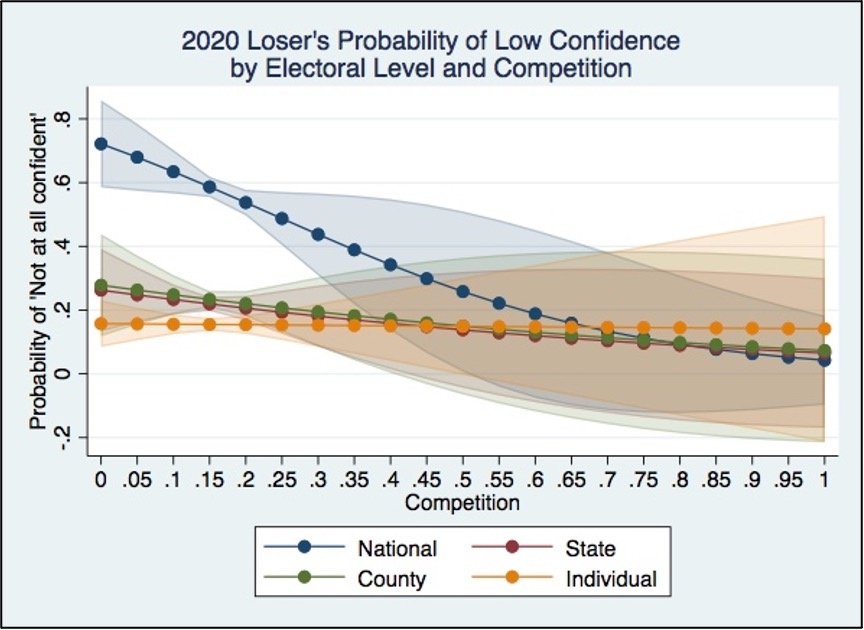
Below, we report the relationship between voter confidence among supporters of losing candidates and state electoral competition for four objects of voter confidence: that their vote was counted accurately, and that votes of other county, state, and national voters were counted as the voters intended. The figure below reports the predicted probability of responding “Not at all confident” to each of these four levels of government. These probabilities were computed from four different ordered logistic regressions with the only difference being the dependent variable corresponding to electoral level.
The predicted probabilities of each model behave differently. The ‘No Harm, No Foul’ hypothesis is strongest at the national level in 2020, with losing respondents in states decided by 5% being almost 40% more likely to respond with the lowest levels of confidence than those in states where a candidate won by 50% of the vote.
However, the effect of losing and competition is much lower when asking respondent for their confidence in their state and county’s vote counting accuracy. At these electoral levels, voters in states decided by 5% of the vote were only 10% more likely to respond that they were ‘Not at all confident’ than those in states decided by 50%.
Finally, a losing voter’s confidence that their individual ballot was counted correctly is almost unaffected by competition with voters in states decided by 5% being only 1% more likely to respond ‘Not at all confident’ compared to those in states decided by 50% of the vote. This shows that the effects of losing and the level of competition is variable across competition type; however (while this is not shown in the graph,) at each electoral level losing voters are more likely to respond ‘Not at all confident’ than winners who have close to 0% probability of selecting this response at all levels.
The Winning Effect and Voting Experience
Thus far we have shown that losing voters in the most competitive states are the voters who are the least confident in the accuracy of the vote count at all electoral levels. However, nobody can randomly assign a state’s level of competition to help counteract the effect of losing an election. Naturally we turn to considering what anyone, specifically local election officials, can do to increase confidence amongst voters who cast a ballot for the losing candidate.
Election officials strive to make a voter’s experience while casting a ballot as positive as possible. This includes taking measures to decrease wait times, hiring competent poll workers, and various other actions to decrease the number of problems a voter has when casting their vote. In addition to these actions, research has shown that making a voter’s experience at the polls more positive leads to an increase in the voter’s confidence that votes are counted accurately. Thus, a natural question to ask is whether or not making a losing voter’s experience at the polls more positive leads to an increase in that voter’s confidence. Can a voter’s experience at the polls counteract the negative effect of voting for the losing candidate?
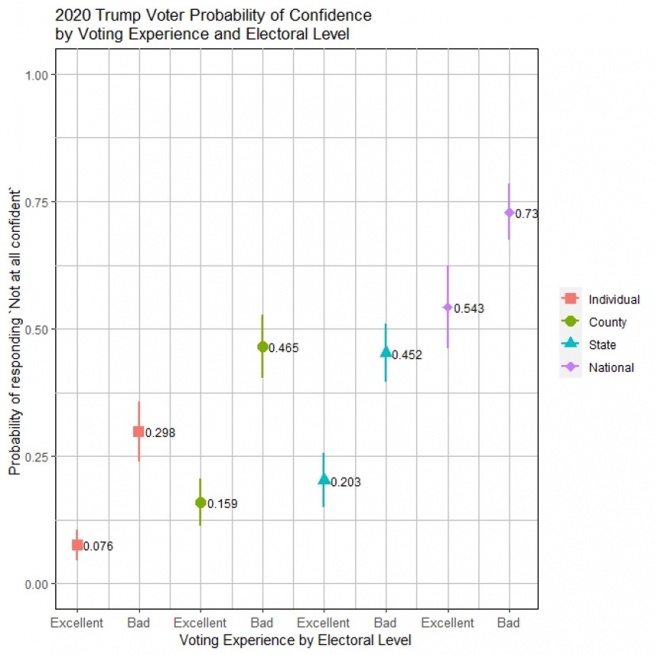
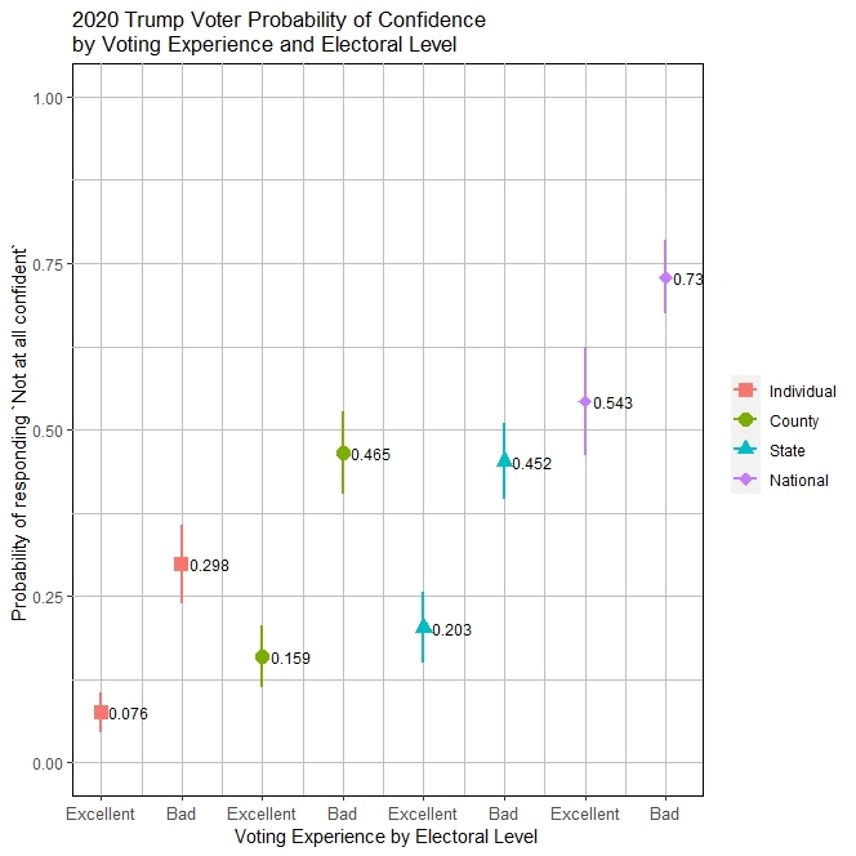
We divide our sample by state competitiveness and focus on those respondents who live in a state that was decided by 10 or less points. We measure a voter’s experience as a dichotomous variable with a value of 1 if they responded that their overall voting experience was “Excellent”. In our model we include an interaction between whether the voter is a Trump voter and if they report an excellent voting experience. As we can see below, across all electoral levels of voter confidence losing Trump voters were significantly less likely to report that they were “Not at all confident” if they reported an excellent voting experience.
Since the conclusion of the 2020 election, many have asked what could be done to repair confidence in American electoral systems. In this post we have shown that confidence is the lowest amongst losers in states that are highly competitive. Furthermore, we have shown that improving the voting experience of these competitive losers can curb the effect of losing and lowering the probability that they report low levels of confidence.
