Solving the Problem of Long Lines on Election Day
What does queuing theory say about managing polling places amid COVID-19?
A general consensus has emerged among the broader elections community that providing a safe voting environment starts by allowing any voter who wishes to vote by mail to do so. This would reduce the number of voters in confined spaces, either on Election Day, or during early voting periods before Election Day. Achieving an increase in voters balloting by mail is recognized by all as being a steep logistical challenge, requiring the reallocation of resources and redesign of procedures at a pace never before seen in the history of American elections.
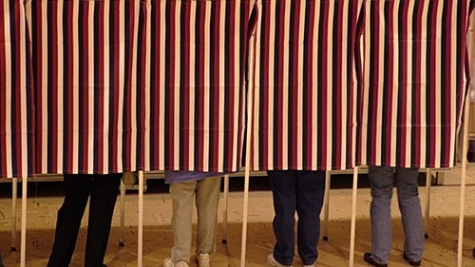
Other voters will choose to vote in person, despite the risks. Some distrust the postal service or feel a sense of civic duty that can only be fulfilled in person. Some voters may vote in person due to a perception that mail balloting is a source of voter fraud.
The Causes and Impacts of Long Lines
The report Managing Polling Place Resources, by Charles Stewart III, was released by the Caltech/MIT Voting Technology Project in 2015, in response to the long lines that beset the 2012 presidential election and the work that followed to reduce the likelihood that such lines would arise again.
That report provides an accessible overview of queuing theory and its application to polling places. Readers unfamiliar with that short report are encouraged to consult it. In light of changes to polling place requirements and procedures precipitated by the COVID-19 pandemic, we’ve revisited the report again. Here, we touch on the six main takeaways from the report, and note how those takeaways apply now in light of COVID.
1. Long lines are not ubiquitous, either across time or space.
This fundamental result will still hold, though an updated set of expectations and proper planning will be needed to ensure that the problem does not become worse this November.
2. Where long lines do occur, they are costly.
The costs can be considered in terms of lost votes, confidence in elections, and time spent by voters. During this pandemic, long lines are especially costly as they will increase the voter’s exposure to infection, especially when lines are inside.
3. Long lines occur in predictable places on a chronic basis.
Long lines are present in a small handful of states, in urban areas, during early voting, and in areas with many non-English speakers.
Similarly, the COVID-19 pandemic is disproportionate in its impact, impacting the elderly, infirm, and communities of color disproportionately severely. These two factors could combine in unfortunate ways to disproportionately impact certain demographics. For an early example, see the Healthy Elections Project’s work surrounding the April 2020 Wisconsin Primary and poll closures in the Milwaukee area.
4. Long lines are due to a mismatch of voters and resources.
Fundamentally, long lines are due to a mismatch between the number of voters who show up and the resources available to accommodate them. Insights from queueing theory provide reliable guidance about how to minimize this mismatch. Queueing theory can also help determine a safe, practical setup for polling places that allows for efficient and safe waiting procedures.
Long lines occur when resources are inadequate. Yet, resources are always constrained, especially in election administration. Thus, managers must decide how best to allocate scarce resources to get the best overall performance. Tools that are based on the science of queueing theory can help managers understand the various trade-offs involved in allocating resources and make the tough decisions that face them.
5. A few localities already provide models of best practices that are addressing voter or election resource mismatches.
Unfortunately, we do not have nearly as much data about voting during a pandemic. Crucial measures of resources and voter behavior are expected to differ significantly from previous years. Lessons from primaries between March and November can be informative.
6. Local jurisdictions need to collect more data.
An important first step in addressing long polling place lines is for local jurisdictions to get into the habit of regularly collecting the data necessary to diagnose the presence of congestion and analyzing it in a way that helps them to allocate the resources they have, or to advocate more effectively for new resources.
The Queuing System
The queueing system is composed of three parts: (1) the arrival of users, (2) the queue itself, and (3) the service that users receive. This is illustrated in the figure below.


To understand a system like this, we need to answer the following questions about each part of the queuing system.
Arrival of voters. At what rate do voters arrive, and how variable is the arrival process?
The queue itself. How do voters wait for service? For instance, do voters queue in the order of arrival so that the first users to arrive are the first to be served? And are there multiple queues, one for each server, or just a single queue that feeds a set of parallel service stations?
The service that voters receive. How many service stations are available to receive voters, how quickly are voters processed, and how variable is the processing time? Many of the fundamental lessons of queueing theory depend upon simple characterizations of the arrival and service processes, in terms of average rates and the level of variation. The existence of variation of any kind will render the same result: queues grow non-linearly as the demands placed on the system increases.
How to make lines shorter at polling stations
Here are four general strategies to make lines shorter at polling places without fundamentally changing the multi-step process.
1. Decrease the arrival rate.
While limiting voting is antithetical to democracy, increasing the number of polling places, expanding the number of early voting days and/or the length of the voting day, or encouraging mail-in ballots are ways to decrease the arrival rate at a given polling place.
2. Increase the number of servers at the bottleneck.
Adding more poll books and workers to the check-in station, if the bottleneck is the check-in step. Alternatively, we can increase the number of voting booths or machines if the bottleneck is at the balloting step. If we increase the number of servers significantly, the bottleneck might shift to another step. Consider a small polling place with one voting booth and one check in station, with the voting booth the bottleneck. Adding a second voting booth may help, but a third voting booth might have minimal impact if it shifts the bottleneck to the check-in step.
3. Decrease the service time at the bottleneck.
Investments in training, simpler processes, and automation are all tools that may help decrease service times. Focusing these efforts to improve the bottleneck step is crucial. An easier-to-read ballot will improve the throughput of the voting step, but won’t help lines if check-in is the bottleneck. Similarly, if service time is significantly reduced, the bottleneck may shift to a different step, making further improvements less valuable.
4. Decrease service and arrival time variations.
When service times and arrival rates vary significantly from voter to voter, lines increase. An example of service-time variation is when voters needing to complete a provisional ballot application join the same line as voters who have a traditional registration. A bus load of voters arriving all at once is an example of arrival-time variation.
To learn more about queuing theory and proposed solutions to the problem of long lines on election day, read the full report: What Queuing Theory Says About Managing Polling Places.