Watchers at the Polls
The Effect of Partisan Poll Watchers on Perceptions of Electoral Fairness
The MIT Election Data and Science Lab helps highlight new research and interesting ideas in election science, and is a proud co-sponsor of the Election Sciences, Reform, & Administration Conference (ESRA).
Our post today was written by Geoffrey Sheagley and Mollie Cohen, based on their paper presented at the 2021 ESRA Conference. The information and opinions expressed in this column represent their own research, and do not necessarily represent the opinions of the MIT Election Lab or MIT.
Introduction
How does the public view poll watchers? Do poll watchers — partisan or otherwise — lead members of the public to be more trusting of elections? Or, does the politicized and partisan nature of poll watchers override these potential benefits and lead voters to be less trusting of elections?
During the 2020 election, there was a great deal of focus on the expanded role partisan poll watchers might play on Election Day. Partisan poll watchers are recruited by the parties to observe election proceedings and to ensure that officials and voters follow the rules. Often expressly forbidden from interacting with voters, these poll watchers work with state officials, poll workers, and the parties to raise potential concerns about election day activities. It seems reasonable to expect, then, that poll watchers should therefore bolster the integrity of — and public trust in — elections.
On the other hand, poll watchers are recruited directly by political parties to work on behalf of that party’s interests. For example, President Trump’s campaign emphasized the importance of recruiting poll watchers to ensure that the election was conducted fairly, without specifying how poll watchers should expect to do so. And some largely partisan election reforms seek to expand the power of partisan watchers at the polls. Because these poll watchers are expressly partisan actors, it’s also possible their presence might actually undermine public trust in elections.
How does the public view poll watchers? Do poll watchers — partisan or otherwise — lead members of the public to be more trusting of elections? Or, does the politicized and partisan nature of poll watchers override these potential benefits and lead voters to be less trusting of elections? These are difficult questions to study with existing data. For one, states employ a wide variety of rules and regulations that govern the recruitment, behavior, and presence of poll watchers. Moreover, most public opinion surveys do not measure voters’ perceptions of poll watchers. Because of these difficulties, we designed an original experiment to examine these questions.
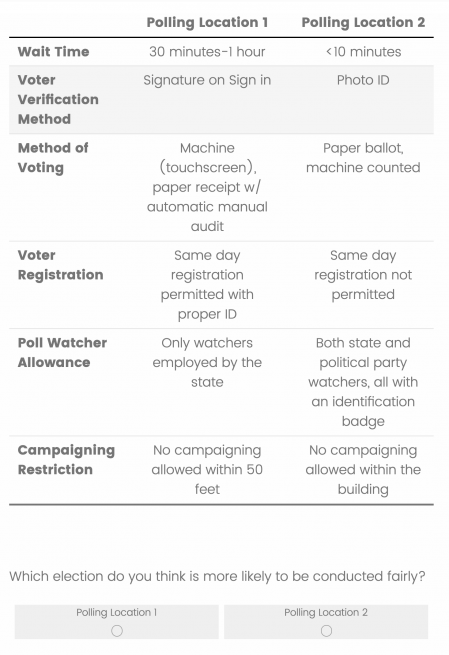
We use conjoint experiments, which present participants with paired choices, to answer these questions. Specifically, we presented respondents with hypothetical election day polling locations with six attributes that randomly took one of several values. Those attributes were:
- The presence and type of poll watchers
- Voter identification requirements
- The method for tabulating ballots
- Registration requirements
- Wait times
- Electioneering laws
In our first experiment, values for the “poll watcher” attribute included:
- None allowed
- Non-partisan
- Non-partisan with identification
- Partisan
- Partisan with identification
- Both non-partisan and partisan
- Both non-partisan and partisan with identification
Figure 1, below, shows an example of one of these comparisons. Participants were asked to identify the polling location where they thought the election would be conducted more fairly.
Study 1 — Partisan and Non-Partisan Poll watchers
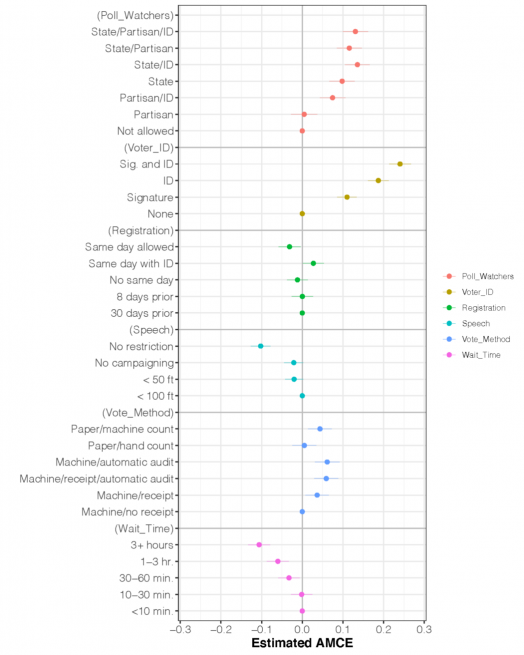
In Spring 2021, we conducted an online survey experiment to test the impact of poll watchers on citizens’ perceptions of electoral integrity. The sample included 1,000 Americans recruited by Bovitz Inc. Figure 2, below, shows the effect of each randomized attribute value on perceptions of electoral fairness. The figure displays how much fairer participants perceived an election with that attribute value would be compared to a base category (the points with no lines through them).
The dependent variable (on the X-axis) ranges from -1 to 1. Each point with a line through it represents how much more (or less) fair participants perceived a polling location with a given attribute level to be relative to a polling location with an attribute that we set as the baseline (represented by points with no lines). The horizontal lines around each point estimate represent 95 percent confidence intervals; if these lines do not cross the vertical line at “0,” that means that attribute level is statistically significantly different from the baseline attribute level. For example, on average, respondents were .08 units (8 percentage points) more likely to view a polling location with partisan poll watchers who used identification as fairer than a location that did not allow poll watchers, and this result is statistically significant.
We find that most types of poll watchers increase perceptions of electoral fairness, compared to a polling location that does not allow poll watchers at all. The one exception is for a partisan poll watcher without identification, which does not change trust in elections compared to a hypothetical location where no poll watchers are allowed (the horizontal line crosses the vertical “0” line). These findings support the notion that poll watchers could improve public perceptions of electoral integrity, at least in some circumstances.
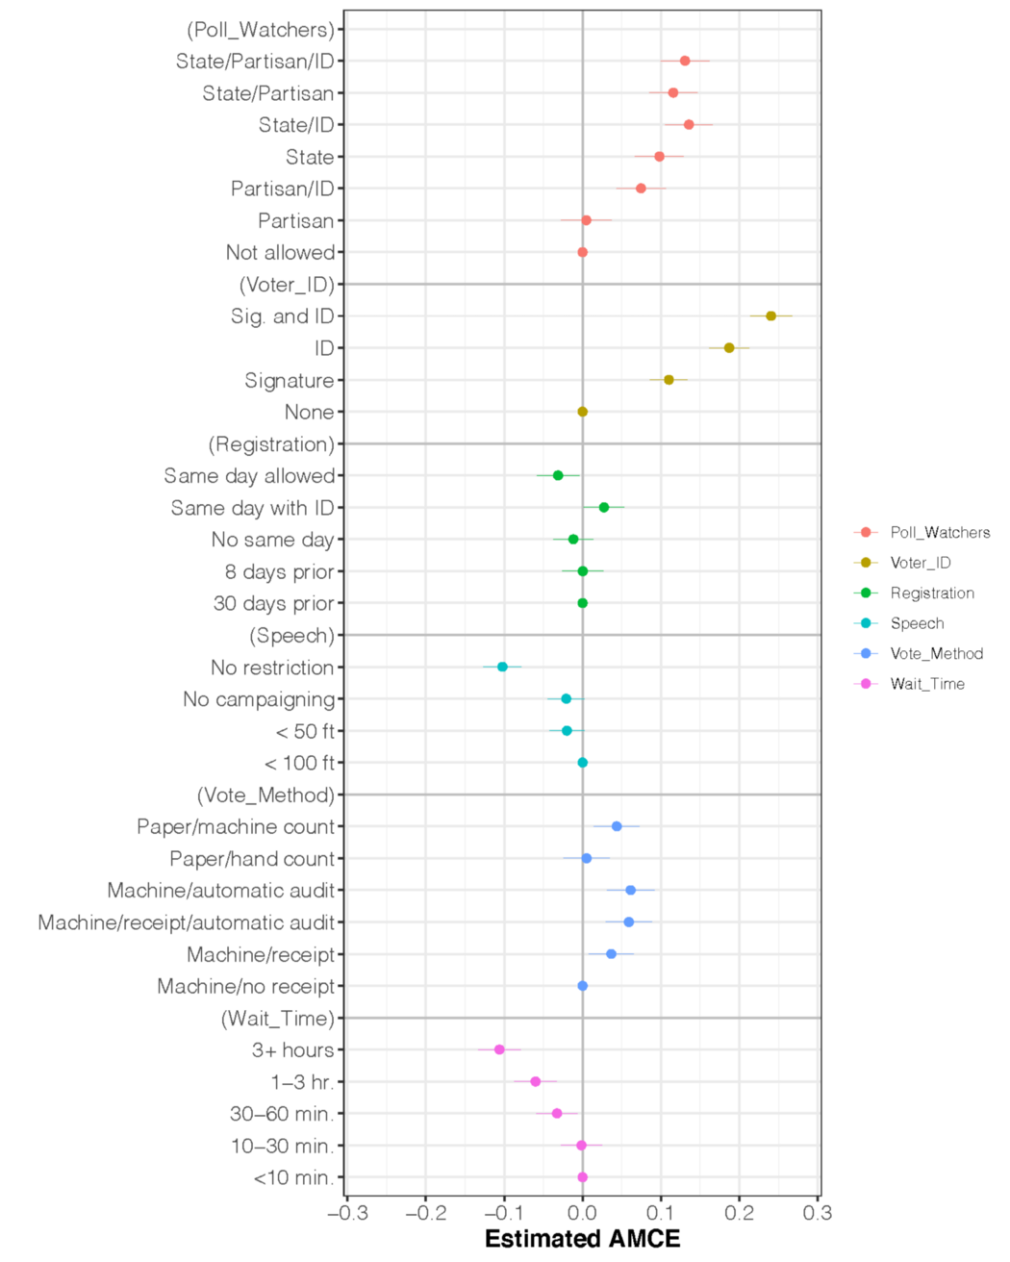
Figure 2. Effect of Randomized Polling Location Attributes on Perceptions of Electoral Fairness
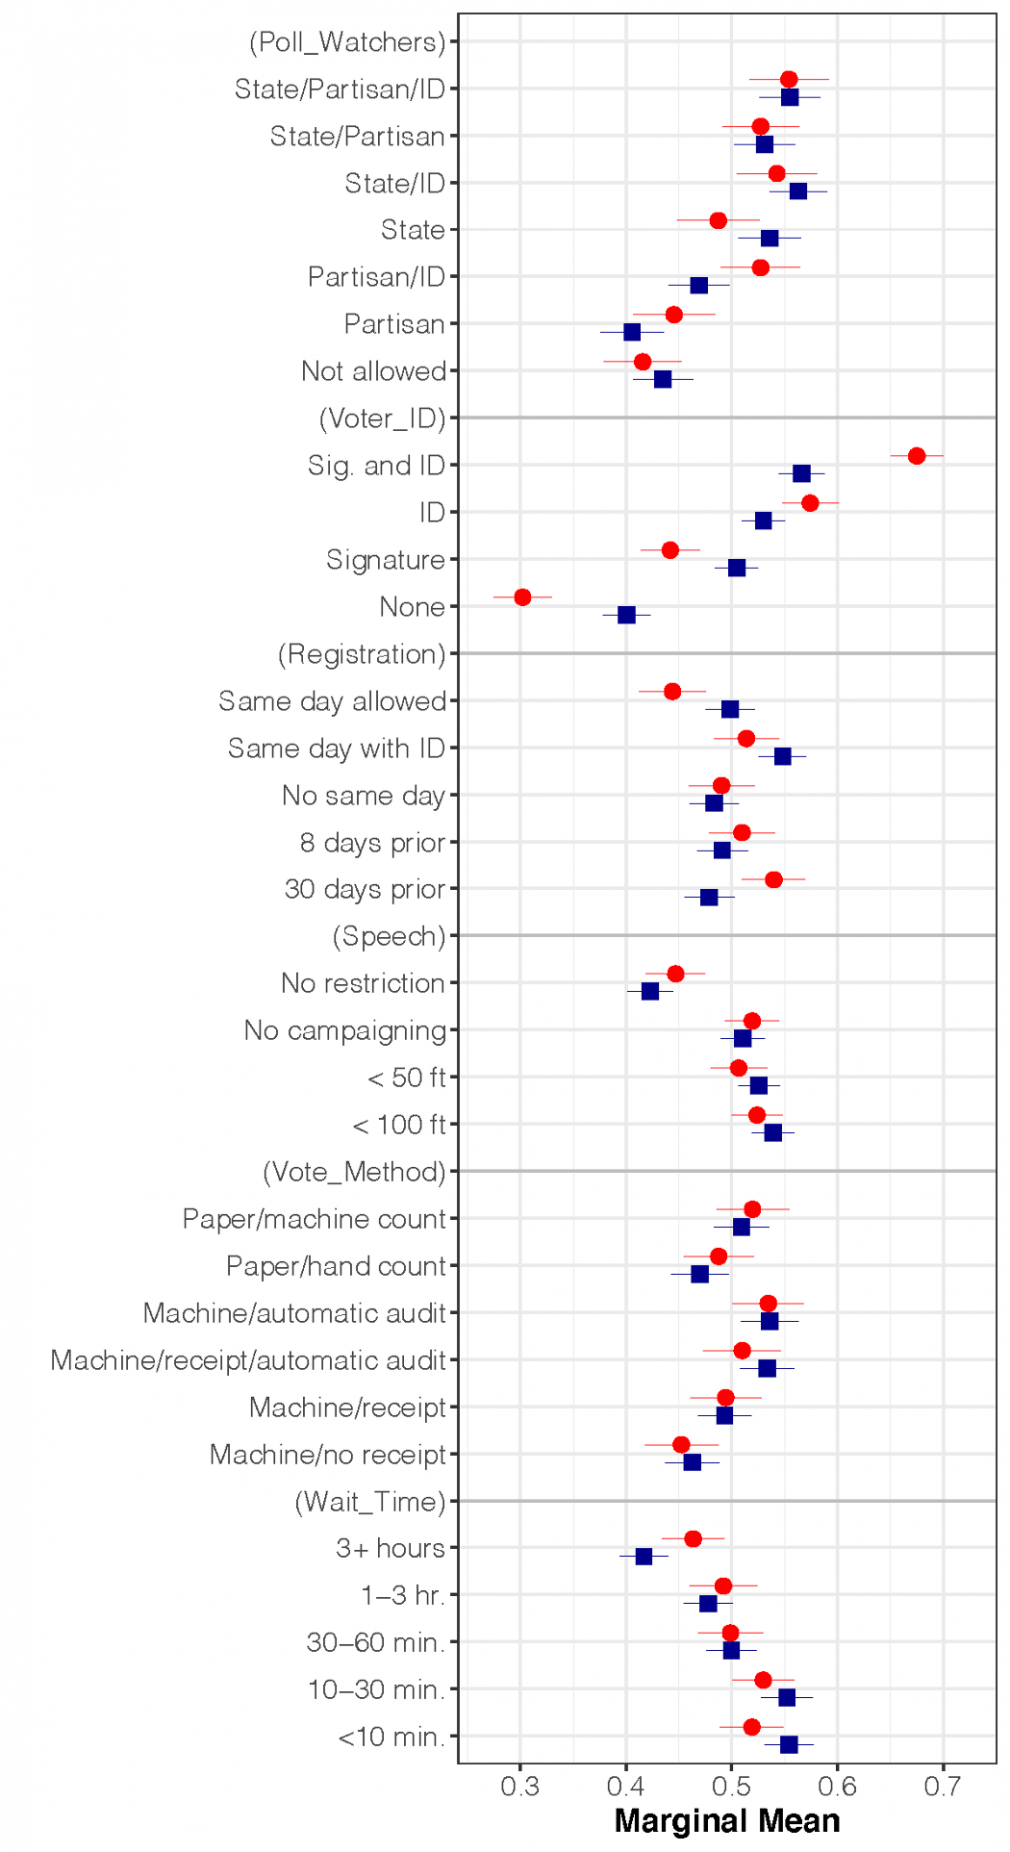
This approach also allows us to directly compare the size of the effect poll watchers have on perceptions to other features of elections that past research has linked to trust in elections. The only feature of elections that affects perceptions of electoral fairness more than poll watchers are different types of voter identification requirements (in yellow in Figure 2 above). In other words, poll watchers can have a substantial impact on voters’ perceptions of an election’s integrity.
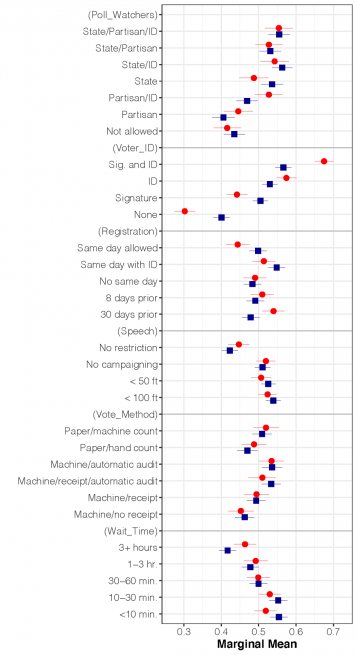
Given the partisan and politicized nature of many poll watchers, it is also important to test whether partisans in the mass public differ in how they view poll watchers. We do this by calculating the effect of each polling location attribute on overall levels of perceived electoral fairness separately for Democrats and Republicans. The results are presented in Figure 3 below (estimates for Republican respondents are in red; Democrats are in blue).
For poll watchers, we observe minimal differences in perceptions of fairness between Republican and Democratic participants. There are some differences — Republicans perceive lower levels of fairness than Democrats when poll watchers are affiliated with the state — but these differences are quite small. This is especially true when compared to the effects of voter identification requirements (in the second panel), which lead to strong differences between Republicans and Democrats.
Study 2 — Asymmetric Partisan Watchers
Study 1 asks about partisan poll watchers, generally. But what happens when only one party has poll watchers at a location? We examined this question in a second study, which uses the conjoint framework but changes how poll watchers are described. For this experiment, we randomly varied the following attributes for the “poll watcher” category:
- No poll watchers present
- Only Democrats (or Republicans)
- Only Democrats (or Republicans) with badges
- Both Democrats and Republicans
- Both Democrats and Republicans with badges
As in the first study, we described each location’s voter identification laws, registration requirements, electioneering laws, ballot tabulation method, and wait times. We fielded this question in a national, demographically diverse sample of 500 Americans collected through Qualtrics in July 2021.
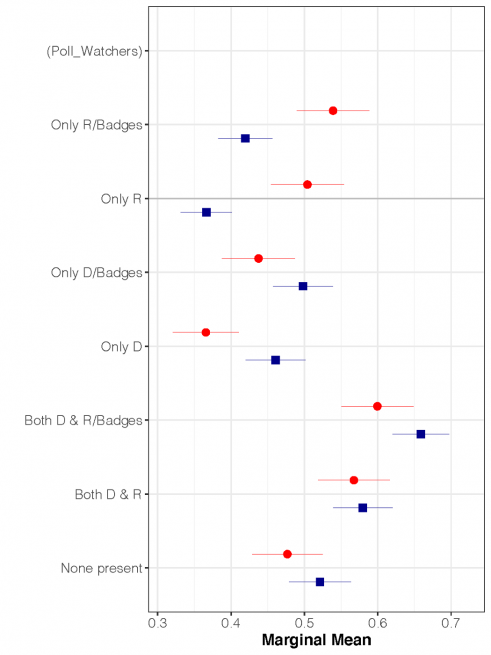
The figure below shows the effect of poll watchers on trust in elections, again by presenting mean level of perceived fairness among Republicans and Democrats in the sample. First, members of both parties perceive the election to be most fair when poll watchers from both parties are present, relative to situations in which none are present or only watchers from one party are present. Second, in elections in which only members of one party are present, participants perceive the election with members of their party are fairer compared to those with only members of the opposite party. Finally, partisans perceive elections in which both parties are represented by poll watchers are fairer even compared to elections in which poll watchers are only from their party.
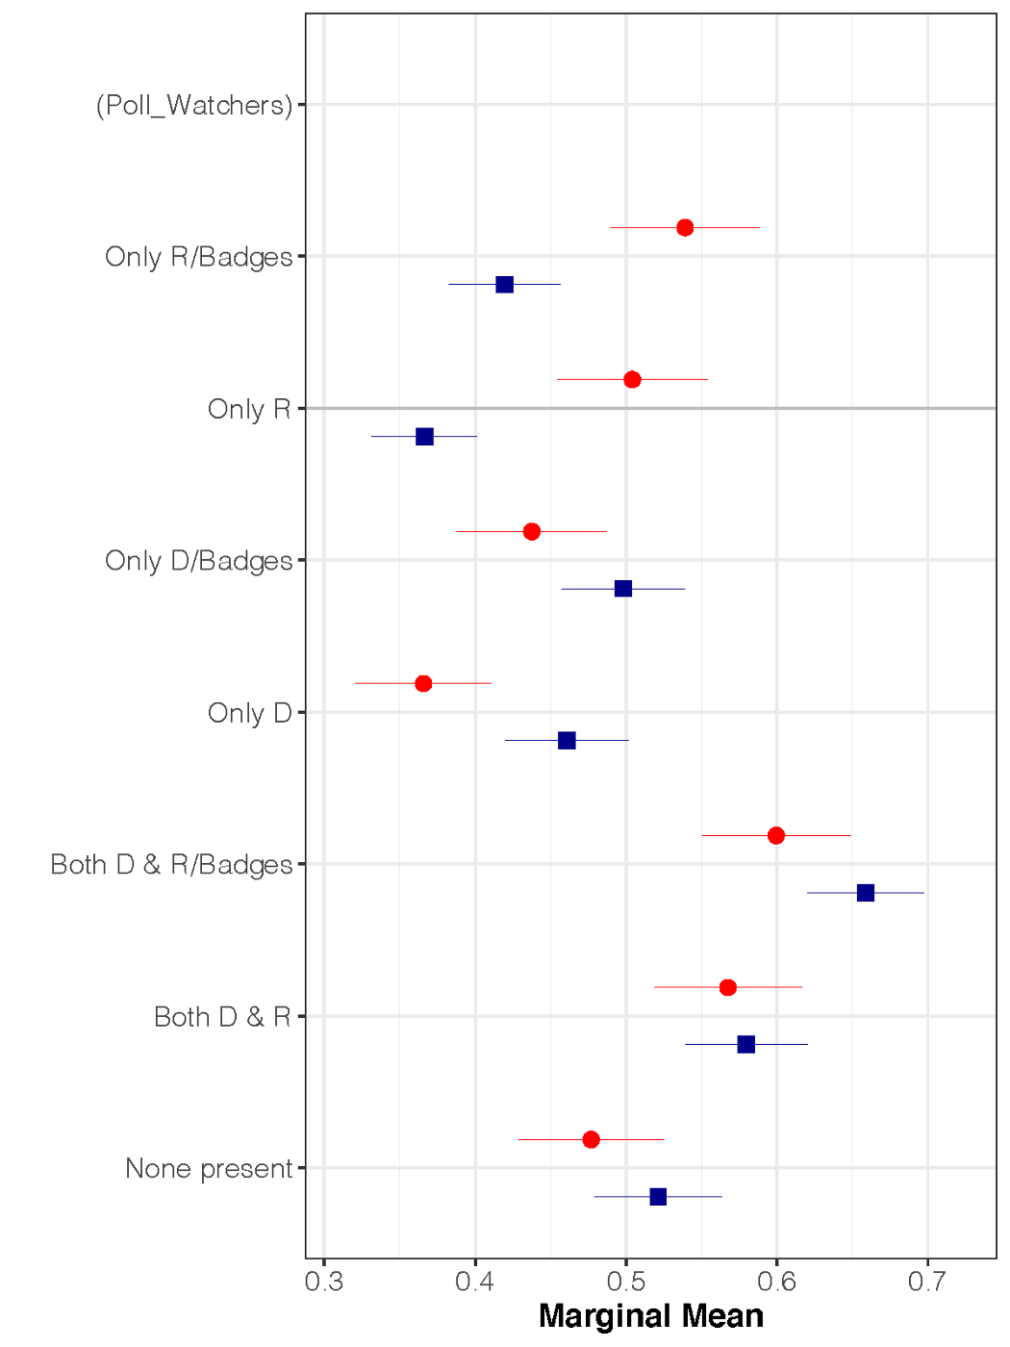
Figure 4. Mean Perceptions of Electoral Fairness by Respondent Party Identification and Randomized Poll Watcher Type (Study 2)
While this work is on-going, it makes three important contributions. First, ours is the first study we have seen that verifies the assumption that learning about the presence of poll watchers impacts citizen perceptions of electoral integrity. Second, the presence of partisan poll watchers does not necessarily harm views of fairness. This is especially true when members of both parties serve as watchers. Finally, our second study suggests some limit to the willingness of co-partisans to trust elections when either their own party or the opposition party is excluded from the process. Even with high levels of polarization and often partisan views of election administration, many partisans agree that having partisan watchers from both parties is more fair.
