Gerrymandering, Turnout, and Lazy Legislators
The MIT Election Data and Science Lab helps highlight new research and interesting ideas in election science, and is a proud co-sponsor of the Election Sciences, Reform, & Administration Conference (ESRA).
Our post today was written by Aryanna Hyde and Edwin Santana, based on their paper presented at the 2021 ESRA Conference. The information and opinions expressed in this column represent their own research, and do not necessarily represent the opinions of the MIT Election Lab or MIT.
Gerrymandering is making headlines again, thanks to the completed census and redistricting process that is finally scheduled to happen across each US state. With this in mind, we were driven to take a closer look at gerrymandering and the effects it has on voters and politicians. Specifically, we have two questions we want answered:
- Do districts whose lines are drawn via politician-dominated processes experience a larger decline in turnout than we would expect after redistricting occurs?
- Do legislators from districts whose lines are drawn via politician-dominated processes produce fewer pieces of legislation?
Background
As we dove into the research around gerrymandering, we were surprised by what we found. Despite being a frequently-raised boogeyman, researchers struggle to conclusively point to whether gerrymandering is the cause of things like polarization, or if its use of protection for incumbents is successful.Also, we found that no prior study had viewed this issue through the lens of how the lines were drawn, not just their end shape.
Researchers and the judiciary have attempted to define gerrymandering in the past, but neither have come to an agreed upon definition. Rather than parse through the varied definitions that are proposed in past studies, we focus instead on how exactly states approach redistricting. The most prominent method by far is politician-dominated, and takes different forms in different states. Some states form politician commissions; in others, the state legislature draws and approves maps as a body. There are a few states that have independent redistricting processes, which are classified as such due to their independence from politicians when considering the shape of the district and who will comprise it. Finally, some states take a hybrid approach, utilizing a mixture of the two to draw their lines.
Methods/Results
To answer our respective questions, we designed two tests that both shared our classification for redistricting processes. To avoid the inevitable obstruction that comes with the lack of clear definitions mentioned above, we focus our analysis on the comparison between how broad categories of redistricting methods compare across our variables of interest.
To classify each state’s redistricting processes, we used All About Redistricting’s database, which provides a central location for how states draw their congressional and state legislature districts, and coded each state’s district-drawing processes as either politician-dominated, independent, or hybrid. Grouping across such broad categories carries several assumptions:
- that politicians consider the political consequences of their maps whereas other redistricting types are at least nominally forbidden from doing so,
- that the effects of any smaller variation among state redistricting types is negligible, and
- that there is enough similarity between redistricting processes of different states in the same category that including them together is sensible.
Our variables of interest are turnout and productivity. To measure turnout, we created the variable Voter Eligible Population (VEP) Turnout. This information is not reported in every district, so for this study some compromises were made to get as accurate a measure as possible. First, we took the reported Voter Eligible Population at the state level and divided it by the number of congressional districts, under the assumptions that congressional districts in a state are roughly the same population. This gave us an estimation of the Voter Eligible Population in the congressional district, which we then divide by the number of votes cast in the election to get a Voter Eligible Population Turnout percentage. For example, if the Voter Eligible Population of a district is 50,000, and 25,000 votes were cast in the election, then we generate a value of Voter Eligible Population Turnout of 50%. (The data used to generate these numbers was pulled from the United States Election Project.)
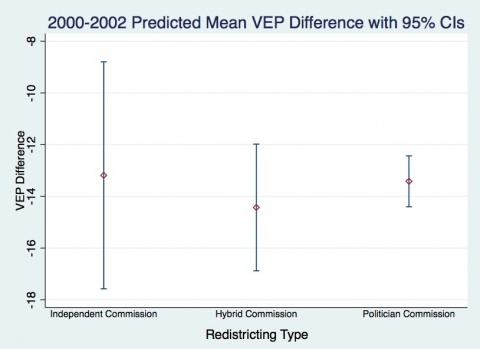
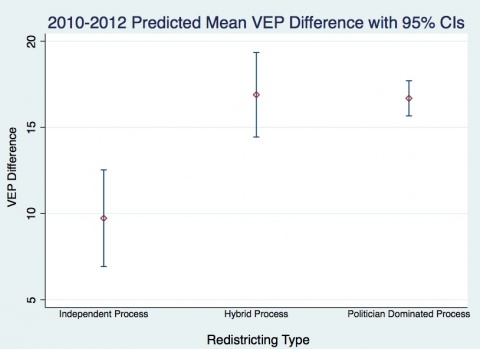
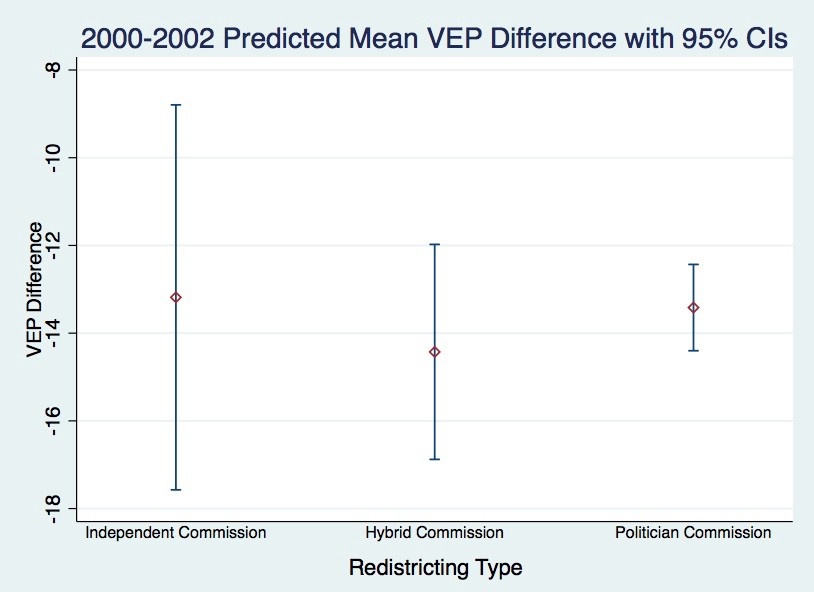
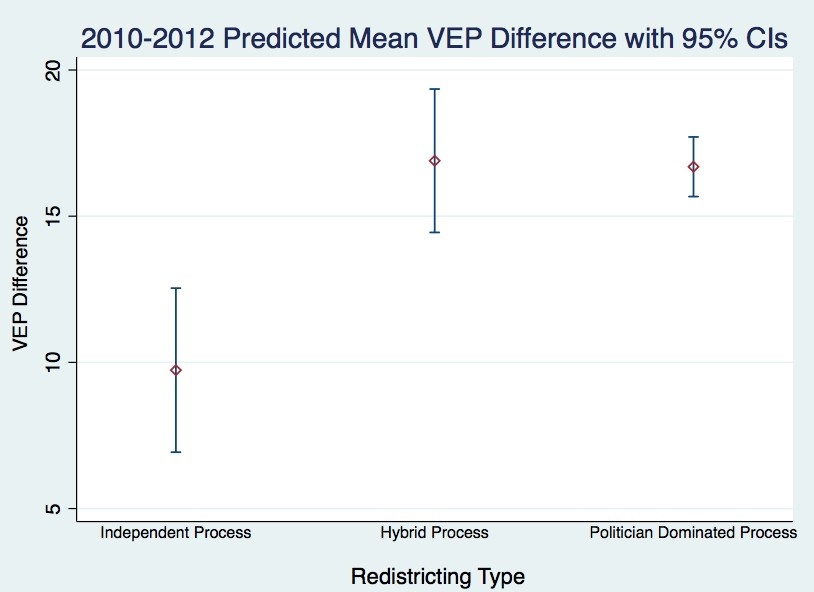
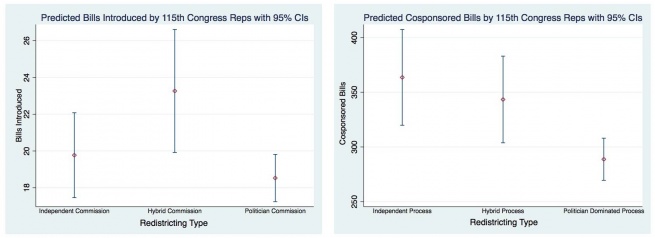
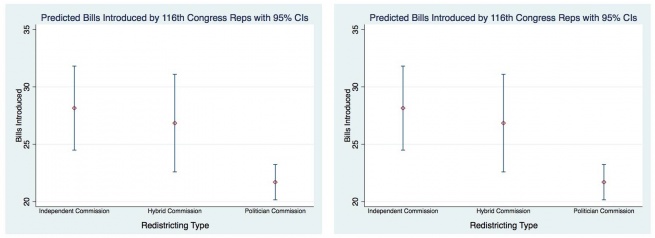
To measure productivity, we examine the number of bills introduced and cosponsored by each representative of the 115th and 116th Congressesaccording to the GovTrack legislative report cards available for those congresses. Our analysis utilizes t-tests and multiple regression estimations to compare between the three different redistricting types mentioned above. Visualizations of those tests are shown below:
Results on voter turnout were mixed. In the 2000–2002 election, results were in line with our hypothesis that politician-dominated processes had an adverse effect on turnout, but in the 2010–2012 election the results showed that politician-dominated processes had a beneficial effect. While we hoped for more conclusive results, examining voter turnout following this redistricting cycle and future cycles can help establish a pattern.
Our test of productivity provided much more conclusive results. For bills cosponsored in the 115th Congress and number of bills introduced in the 115/116th Congress, we consistently found that legislators representing districts whose lines were drawn via politician-dominated processes produced fewer bills. In the 115th Congress alone, those legislators on average cosponsored 100 fewer bills than their colleagues from independently drawn districts. The variable with the largest effect was political party. With the differences in philosophical approach to governance taken by both parties, we did expect some difference between the two. However, our regression estimations indicate that the predicted difference in number of bills cosponsored between a Republican and non-Republican representative is as big as 290 bills, which seems larger than philosophical differences between parties would imply.
Moving Forward
While the results shown above are compelling, there are several steps we believe are important moving forward. First, to better examine the impact of redistricting on turnout, we would like to look at how election results following the redistricting taking place later this year compare to the results shown in the 2000–2002 and 2010–2012 cycles. It is difficult to look further in the past to test these results since the methods used to draw district lines become more homogeneous.
It would also be helpful to derive a turnout measure that accounts more precisely for population and voting population changes. Our VEP Turnout measure is useful, but we also acknowledge the error that comes along with it and hope to refine it in the future. The productivity measures used showed some interesting results, and it would be useful to use the simple tests across more congresses and productivity measures to see if those patterns continue to show up. We are also interested in further honing the estimations we use to be sure the patterns are not the result of specific variables and measures.
Overall, there do seem to be some important differences between districts that use politician dominated redistricting processes and those that do not. Going forward, more states are looking to transition towards independent redistricting processes in an attempt to remove politics from the equation, and our results provide tangible indications that who draws the district lines affects turnout and has an effect on performance of legislators once in office. We predict that as more districts rely on independent processes to draw congressional lines that the differences in turnout and legislator productivity will only become more pronounced.
