Important legislation in the twentieth century, most notably the Voting Rights Act of 1965, has led to a long-term increase in the ability of Americans to participate in elections. The effects of other legislation intended to increase turnout, such as the National Voter Registration Act, have been more limited to specific administrative practices across states.
This explainer was last updated on April 28, 2021.
What is 'voter turnout'?
Because high voter turnout is considered a mark of a thriving democracy, policymakers and citizens often support electoral reform measures based on whether they will increase turnout, either overall or for particular groups.
Although the idea of voter turnout is simple, measuring it is complicated. And even if the number of people who voted in an election is accurately counted, it's often unclear what turnout should be compared to—the number of eligible voters? Registered voters?
Political debates often rage over whether particular reforms will raise or lower turnout, either overall or for particular groups. In the 2020 election particularly, the rapid changes in how elections were administered, due to the pandemic, resulted in particularly heated discussions over election reforms and their effects.
Measuring Turnout
Turnout can be measured in the aggregate by simply counting up the number who vote in an election. Data from the United States Elections Project (USEP) indicates that 159.7 million voters participated in the 2020 presidential election. While it was previously difficult to determine the number of ballots cast and instead had to rely on the most ballots cast in a “highest off” (i.e. the office with the most votes for a candidate), more and more states are reporting total ballots counted alongside the results of the election. Nonetheless, in 2020, seven states (Kansas, Kentucky, Mississippi, Missouri, Oklahoma, Pennsylvania, and Texas) did not record how many people turned out to vote.
With the number of voters determined, we can now discuss the selection of the denominator to calculate the turnout rate. Often, states and news sources will provide turnout numbers that use registration as the denominator. This results in inconsistent measurements across states due to inconsistent practices, policies, and/or laws around the maintenance of their voter registration lists. For a more consistent measure, it is better to use a measure that reflects the population of possible voters.
The easiest comparison is with the voting age population (VAP)-that is, the number of people who are 18 and older according to U.S. Census Bureau. However, VAP includes individuals who are ineligible to vote, such as non-citizens and those disfranchised because of felony convictions. Thus, two additional measures of the voting-eligible population have been developed:
- Citizen Voting Age Population (CVAP) , which is based on Census Bureau population estimates generated using the American Community Survey.
- Voting Eligible Population (VEP), which is calculated by removing felons (according to state law), non-citizens, and those judged mentally incapacitated.
The denominator one chooses to calculate the turnout rate depends on the purposes of the analysis and the availability of data. Usually, VEP is the most preferred denominator, followed by CVAP, and then VAP. The estimated VEP in 2020 was 239.4 million, compared to an estimated VAP of 257.6 million.
Figure 1 shows the nationwide turnout rate in federal elections, calculated as a percentage of VEP by the USEP , from 1980 to 2020. In addition to the variation across time, the most notable pattern in this graph is the difference in turnout between years with presidential elections ("on years") and those without presidential elections ("off years"). Elections that occur in odd-numbered years and at times other than November typically have significantly lower turnout rates than the ones shown on the graph. (The turnout rate in the 2020 presidential election was the greatest since 1904.)
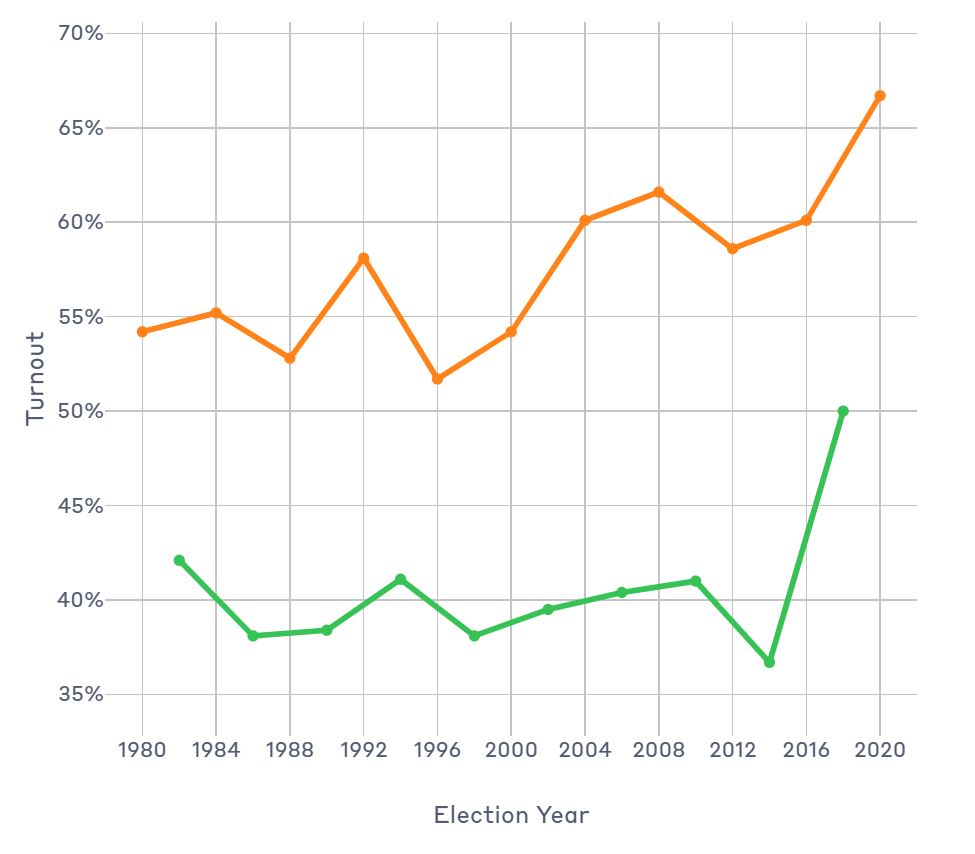
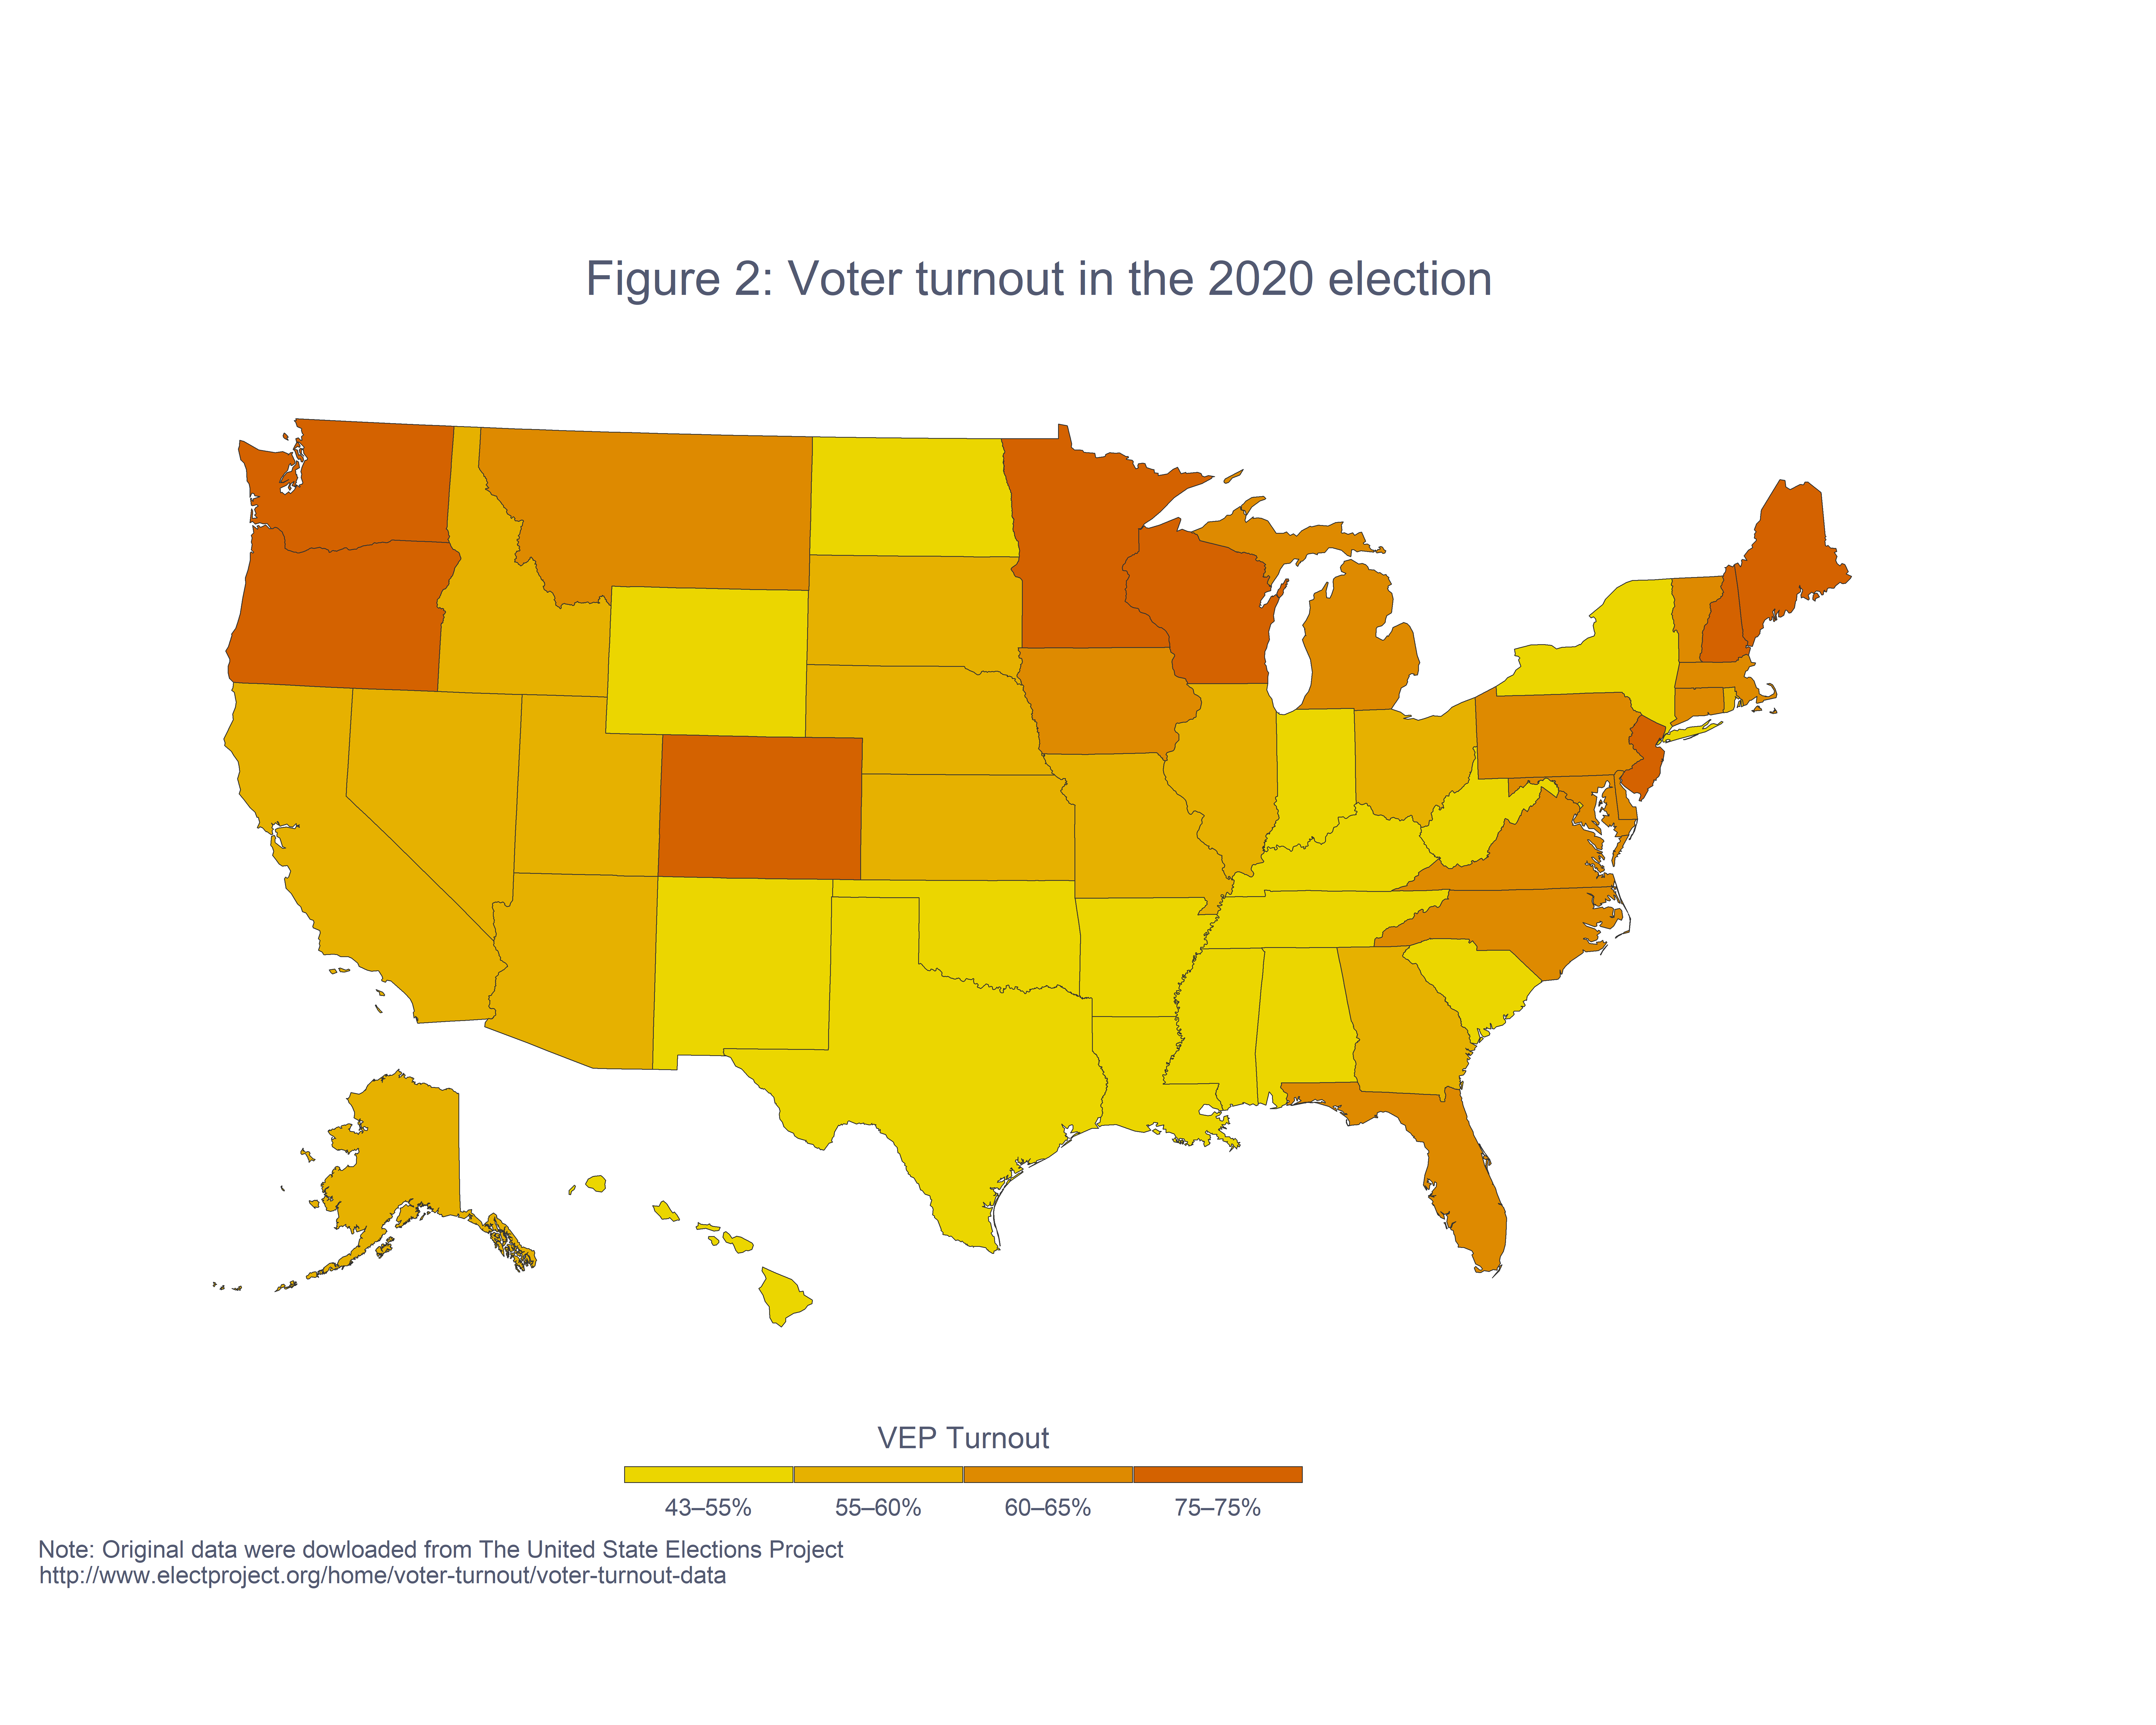
Figure 2 shows turnout rates in the 2020 election for each state. Although there are exceptions, states with the highest turnout rates in presidential elections tend to be in the north, while states with lower turnout rates tend to be in the south.
Studying voter turnout
Sometimes we want to measure the turnout rates of groups of voters, or study the factors that lead individual citizens to vote. In these cases, we need individual measures of turnout based on answers to public opinion surveys.
The chief difficulty in using public opinion surveys to ascertain individual voter turnout is the problem of social-desirability bias , whereby many respondents who did not vote will nonetheless say they did to look like good citizens. As a result, estimates of turnout rates based on surveys will be higher than those based on administrative records. (For example, 78% of respondents to the 2012 American National Election Studies survey reported voting, compared to the actual turnout rate of 58% as reflected in the graph above.) To guard against over-reporting turnout in surveys, some studies use voter registration records to independently verify whether respondents voted, but few do.
Even with the problems of over-reporting, public opinion surveys are usually the only way we can study the turnout patterns of subpopulations of voters, such as regional or racial groups. It would be safe to use these surveys if all groups over-report on whether they voted by equal amounts, but there is evidence they don’t.
One consequence of the secret ballot is the inability to directly tie demographic factors to an actually recorded vote. Instead, researchers have relied on Voting and Registration Supplement (VRS) of the U.S. Census Bureau’s Current Population Survey (CPS) to gather information about the demographic factors that affect turnout. The CPS is a monthly survey on employment and the economy. The VRS, which is administered every November in even-numbered years, asks respondents whether they voted in the most recent election. Because the CPS already has a rich set of demographic information about each voter and has been conducted for decades, this is often the best source of data
The dominant theory for why turnout varies focuses on a type of cost-benefit calculation as seen from the perspective of the voter. Voters balance what they stand to gain if one candidate beats another, vs. their economic or social costs of voting. Other scholarship has challenged this approach by showing that going to the polls is largely based on voting being intrinsically rewarding.
A long history of political science research has shown that the following demographic factors are associated with higher levels of voter turnout: more education, higher income, older age, and being married (see table below). Women currently vote at slightly higher levels than men.
Can reforms increase turnout?
Can particular election reforms such as Election Day registration, vote-by-mail, early voting, photo ID, etc., have an effect on voter turnout? Research results in most of these areas have been mixed at best. The one reform that is most consistently correlated with higher levels of turnout is Election Day registration (EDR), although even here, there is disagreement over whether EDR causes higher turnout or if states with existing higher turnout levels are more likely to pass EDR laws (it’s probably a combination of the two).
What about the roles that campaigns play in stimulating voter turnout? This is most visible in presidential elections, where candidates pour disproportionate resources into campaigning in battleground states—those that are closely divided along partisan lines and thus are most likely to swing the result of the Electoral College vote. In 2020, the average turnout in the 8 states where the presidential margin of victory was 5 percentage points or less was 70%, compared to 59% in the nine states where the margin of victory was greater than 30 points. (For the states in-between, the average turnout rate was 68%.)
Field experiments to test the effects of campaign communications on voter turnout have shown that personalized methods work best in mobilizing voters and mass e-mails are virtually never effective in stimulating turnout.
What if everyone voted?
We care about turnout levels for two reasons. First, they're considered a measure of the health of a democracy, so higher turnout is always better than lower turnout. Second, if we believe that lower turnout levels exclude citizens with particular political views, then increasing turnout would “unskew” the electorate.
Early research seemed to justify skepticism that increasing turnout in federal elections would radically change the mix of opinions among those who actually vote. However, more recent research suggests that voters in national elections are more likely to be Republican and to oppose redistributive social policies than non-voters. Differences between voters and non-voters on other issues such as foreign policy are much less pronounced.
When it comes to local elections, overall turnout rates tend to be much lower than elections held to coincide with federal elections, and the demographic characteristics of voters are much more skewed compared to non-voters.
Suggested Readings
Aldrich, John H. 1993. "Rational Choice and Turnout." American Journal of Political Science 37 (1): 246–278.
Hur, Aram and Christopher H. Achen. 2013. “Coding Voter Turnout Responses in the Current Population Survey.” Public Opinion Quarterly 77(4); 985 – 993.
Wolfinger, Raymond E., and Steven J. Rosenstone. 1980. Who Votes? New Haven: Yale University Press.